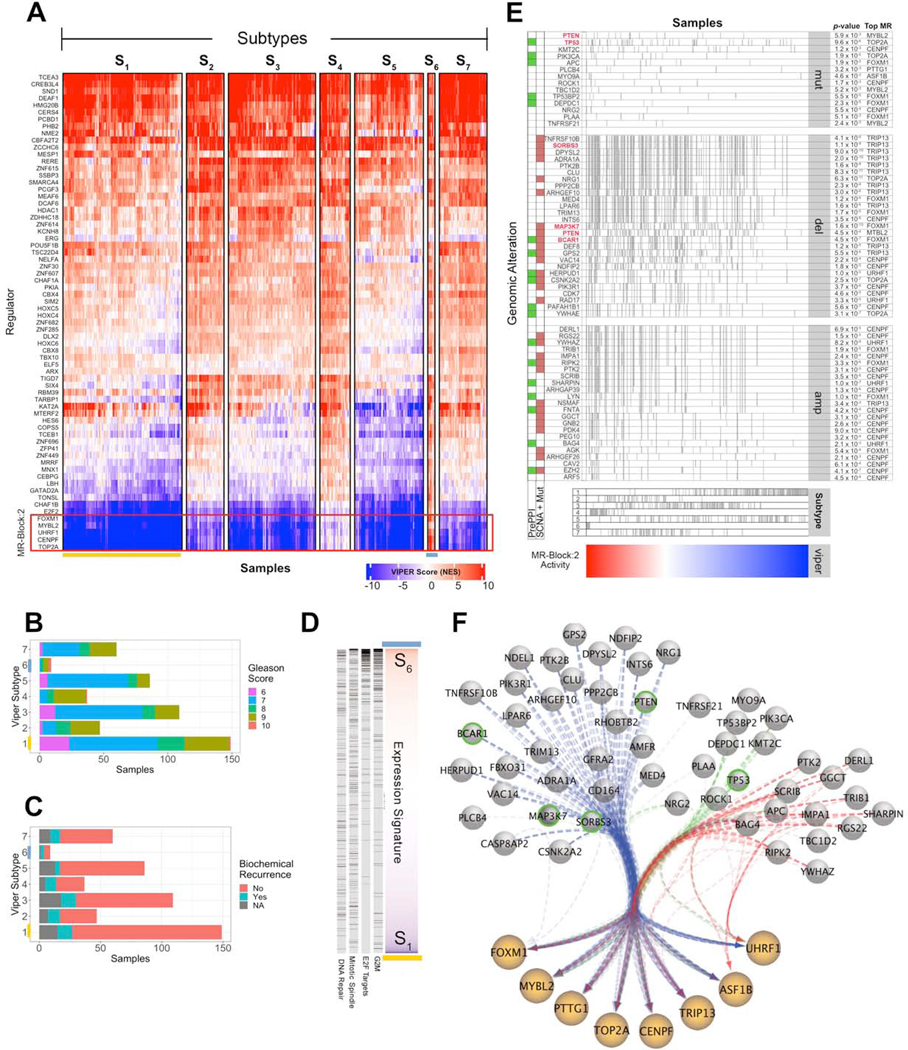
Figure 6. MRB 2 and its upstream genetic alterations drive the most aggressive PRAD subtype.
(A) Heatmap showing MR-based clustering of the TCGA prostate cancer cohort (PRAD) into 7 molecularly-distinct subtypes, as described in Figure 2C. (B) Gleason Score frequency stratification by subtype. (C) Biochemical recurrence status by subtype. (D) Enrichment of genes in MRB:2 hallmark categories in genes differentially expressed between S1 and S6 subtypes, sorted by Student’s t-test analysis. Genes in each hallmark are shown as black ticks and statistical significance is computed by GSEA analysis (p < 2.2×10⁻¹⁶, i.e., below minimum computable significance). (E) Genomic events significantly associated with MRB:2 activity. Samples (columns) are sorted by MRB:2 activity (bottom heatmap) and presence of a specific genomic event is shown as vertical tick-marks. Functional SCNA events for genes that also harbor mutations in the cohort are marked with a brown square. Those involved in protein-protein interactions with MR proteins, based on PrePPI analysis, are marked with a green square. Events are ranked based on their subtype frequency. The top integrated aQTL, CINDy and PrePPI association p-value (using Fisher’s method) for each event with a MRB:2 MR is shown on the right side. The five genes selected for experimental validation are highlighted in red. We also indicate the subtype designation per sample, as shown as tick marks above the heatmap. (F) Network diagram of MRB:2 proteins with edges representing a select set of DIGGIT-inferred alteration-MR interactions—including for deletions (blue), mutations (green), and amplification events (red)—shown as bundled edges. Green-circled events were selected for experimental follow-up.
See also Table S3.

