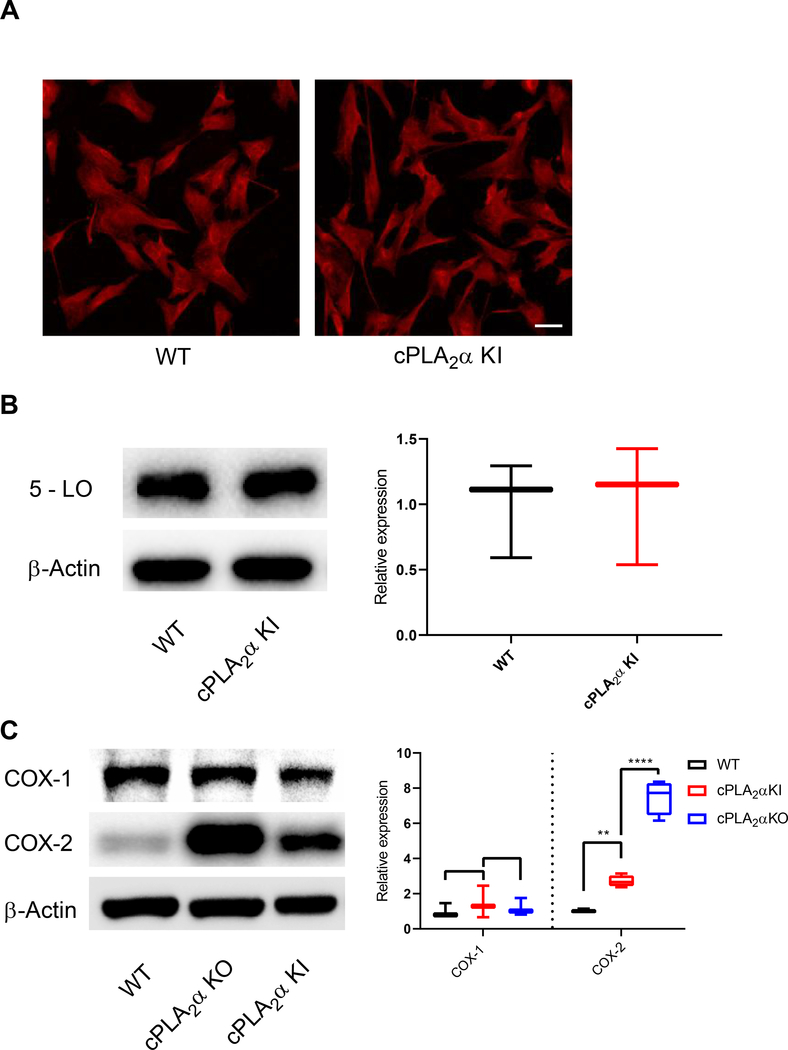
Fig. 10. Dermal fibroblasts from KI mice show no changes in the localization and abundance of 5-lipoxygenase.
(A) Immunofluorescence showing 5 - LO in pDFs from WT and cPLA2α KI mice. Scale bar, 40 μm. (B) Immunoblotting and quantification of 5 - LO in pDFs from WT and KI mice. (C) Immunoblotting and quantification of COX-1 and COX-2 in WT, KI, and KO pDFs. Data shown are means ± SD, n = 5–6 cell isolates per genotype (3–4 mice per genotype were used to generate the cell isolates) for confocal microscopy, n = 3 cell isolates per genotype (3 mice per genotype were used to generate the cell isolates) for immunoblot analysis, *P< 0.05, **P< 0.01, ***P< 0.001, ****P< 0.0001.

