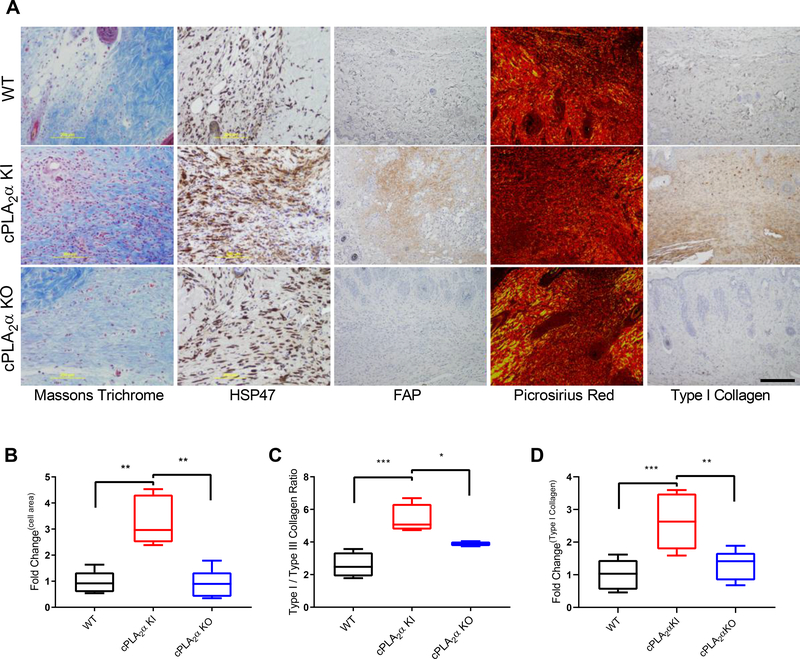
Fig. 3. Fibroblast infiltration and collagen deposition are increased in wounds in KI mice.
(A) Representative image showing Masson’s trichrome stain, HSP47 distribution, FAP distribution, Picrosirius red staining, and Type I collagen distribution in wound sections from WT, cPLA2α KI, and cPLA2α KO mice 10 days after excisional wounding. Scale bar, 200μm. (B) Graphical representation of FAP+ cells per field. The values are presented relative to that for WT, which was set to 1. (C) Graphical representation of the ratio of type I to type III collagen estimated from polarized light imaging of Picrosirius red –stained wound sections. (D) Graphical representation of the surface area that was positive for type I collagen in wound sections. The values are presented relative to that for WT, which was set to 1. Samples were compared using ANOVA followed by Tukey’s post-hoc test. Data shown are means ± SD, n = 4–7 mice per genotype, *P< 0.05, **P< 0.01, ***P< 0.001, ****P< 0.0001.

