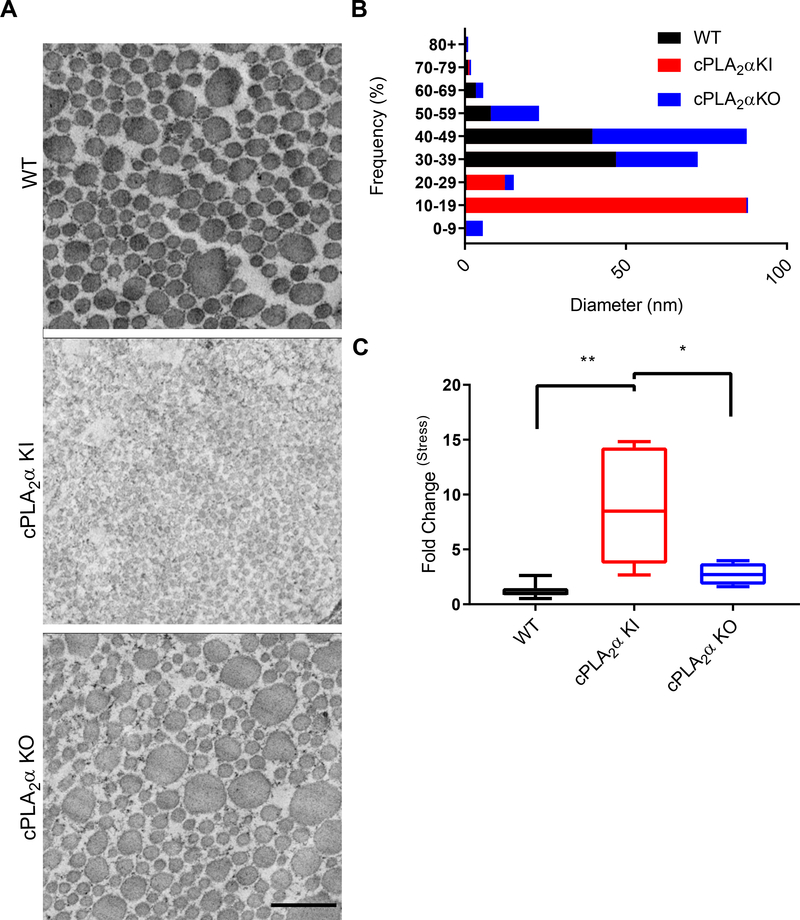
Fig. 4. Healed wounds from KI mice have thinner collagen fibers and increased tensile strength.
(A) Transmission electron microscopy (TEM) showing collagen fibers in stinted excisional wounds from WT, cPLA2α KI, and cPLA2α KO mice after 10 days of healing. Scale bar, 500 nm. (B) Graphical representations of collagen fiber diameter measured from TEM images. (C) Quantification of wound tensile strength in 2 cm incisional wounds from WT, KI, and KO mice 10 days after wounding. The values are presented relative to that for WT, which was set to 1. Samples were compared using ANOVA followed by Tukey’s post-hoc test. Data shown are means ± SD, n = 2–3 mice per group for TEM, n = 4–7 mice per group for wound tensile strength, *P< 0.05, **P< 0.01.

