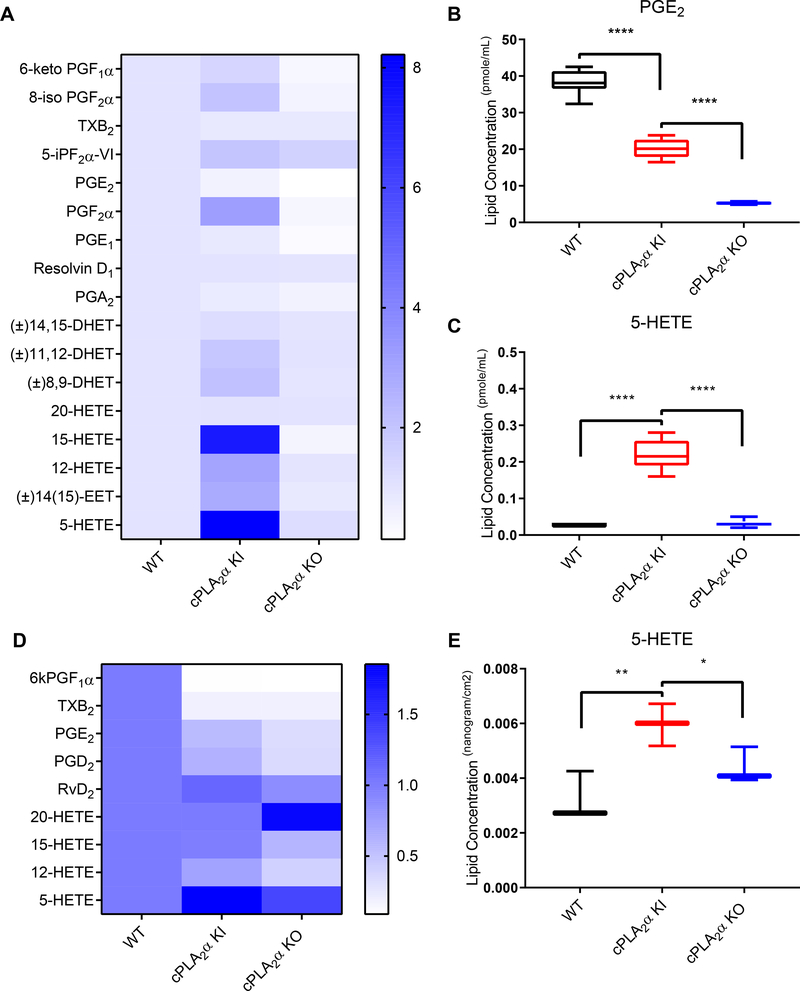
Fig. 6. Genetic ablation of the C1P-cPLA2α interaction alters eicosanoid synthesis in primary dermal fibroblasts and healed excisional wounds.
(A) Complete lipid profile of pDFs from WT, cPLA2α KI, and cPLA2α KO mice shown as fold change in comparison to WT pDFs. (B) Quantification of PGE2 in pDFs from WT, KI, and KO mice. (C) Quantification of 5-HETE in pDFs from WT, KI, and KO mice. (D) Partial lipid profiles from excisional wounds in WT, KI, and KO mice. (E) Quantification of 5-HETE in excisional wounds from WT, KI, and KO mice. Samples were compared using ANOVA followed by Tukey’s post-hoc test. Data shown are means ± SD, n = n = 6–8 cell isolates per genotype (4–5 mice per genotype were used to generate the cell isolates) for (A–C), n = 3 mice (one wound per mouse) per genotype in (D, E). *P< 0.05, **P< 0.01, ***P< 0.001, ****P< 0.0001.

