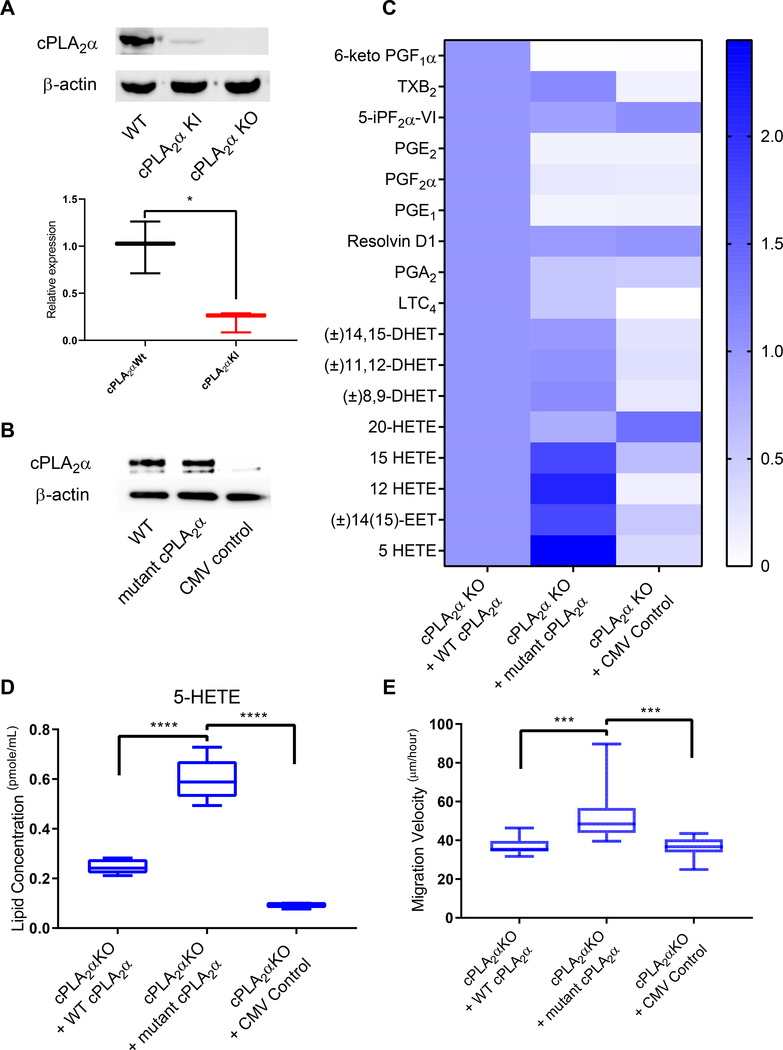
Fig. 7. Expression of mutant cPLA2α reproduces the KI phenotype in KO pDFs.
(A) Immunoblotting and quantification of cPLA2α in pDFs from WT, cPLA2α KI, and cPLA2α KO mice. β-actin is a loading control. n = 3 cell isolates per genotype (3–4 mice per genotype were utilized to generate the cell isolates). (B) Immunoblotting for cPLA2α in cPLA2α KO pDFs in which an adenoviral (CMV) expression system (30) was used to drive expression of WT cPLA2α or C1P-binding mutant cPLA2α. Empty vector is a negative control. Data is representative of n = 3 independent experiments using cells isolated from different cPLA2α KO mice. (C) Lipid profiles of WT and KI pDFs expressing WT or mutant cPLA2α from the CMV vector. (D) Quantification of 5-HETE in KO pDFs expressing WT or mutant cPLA2α from the CMV vector. For (C) and (D), n = 3 (empty CMV control) and n = 9 (WT and mutant cPLA2α) cell isolates from 5 cPLA2α KO mice. (E) Migration velocity in KO pDFs expressing WT or mutant cPLA2α from the CMV vector. n = 12 cell isolates per genotype (6–9 mice per genotype were used to generate the cell isolates). Samples were compared using ANOVA followed by Tukey’s post-hoc test. Data shown are means ± SD*P< 0.05, **P< 0.01, ***P< 0.001, ****P< 0.0001.

