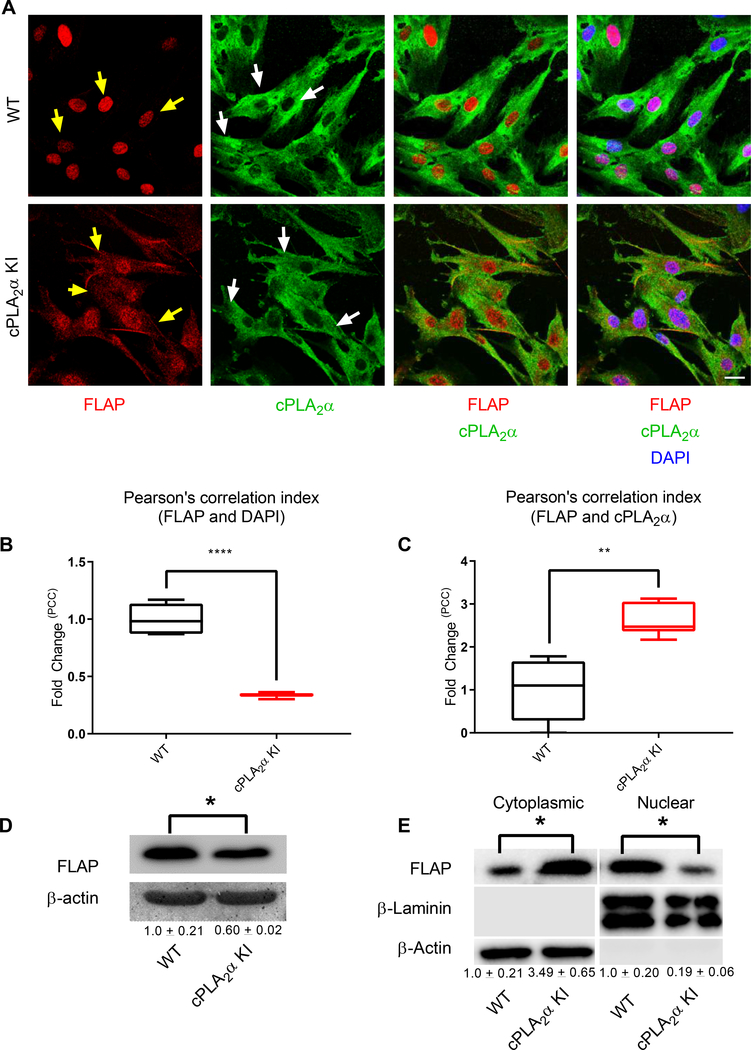
Fig. 9. Primary dermal fibroblasts from KI mice show altered localization of cPLA2α and FLAP.
(A) Immunofluorescence showing FLAP (nuclear and cytosolic, yellow arrows) and cPLA2α (Golgi/perinuclear and cytosolic, white arrows) in pDFs from WT and cPLA2α KI mice. Nuclei are labelled with DAPI. Scale bar, 40 μm. (B) Cytosolic localization of FLAP correlated to nuclear staining was quantified as fold-change in the Pearson’s Correlation Coefficient (PCC) in KI pDFs relative to that in WT pDFs. (C) C-localization of FLAP with cPLA2α was quantified as fold-change in the PCC in KI pDFs relative to that in WT pDFs. (D) Immunoblotting and quantification (numbers below blots) of FLAP in pDFs from WT and KI mice. (E) Immunoblotting and quantification of FLAP in nuclear and cytoplasmic fractions of WT and KI pDFs. Colocalization was determined using Pearson’s correlation index, samples were compared using unpaired students t-test with Welch’s correction. Data shown are means ± SD, n = 5–6 cell isolates per genotype (4–6 mice per genotype were used to generate the cell isolates) for confocal microscopy, n = 4 cell isolates per genotype (3 mice per genotype were used to generate the cell isolates) for immunoblot analysis, *P< 0.05, **P< 0.01, ***P< 0.001, ****P< 0.0001.

