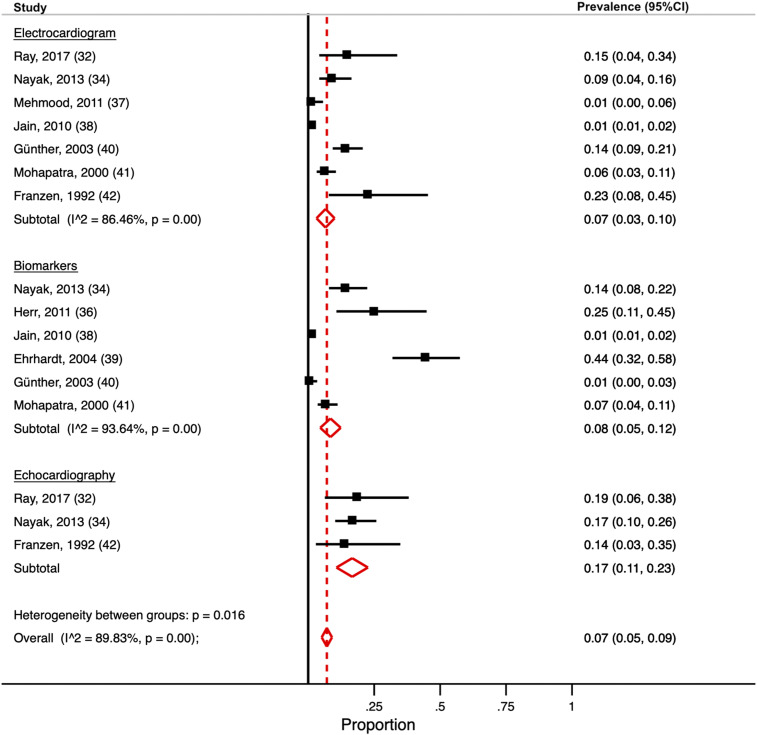
Figure 2.
Meta-analysis of cardiovascular complications. Forest plot for random-effects meta-analysis displaying the proportions and pooled estimate for having cardiovascular complications. Subgroup meta-analysss are conducted for abnormal electrocardiogram, biomarkers, and echocardiography. Solid black lines indicate the prevalence estimate for each included study. Red dashed line indicates the pooled prevalence estimate for any cardiovascular complication. This figure appears in color at www.ajtmh.org.

