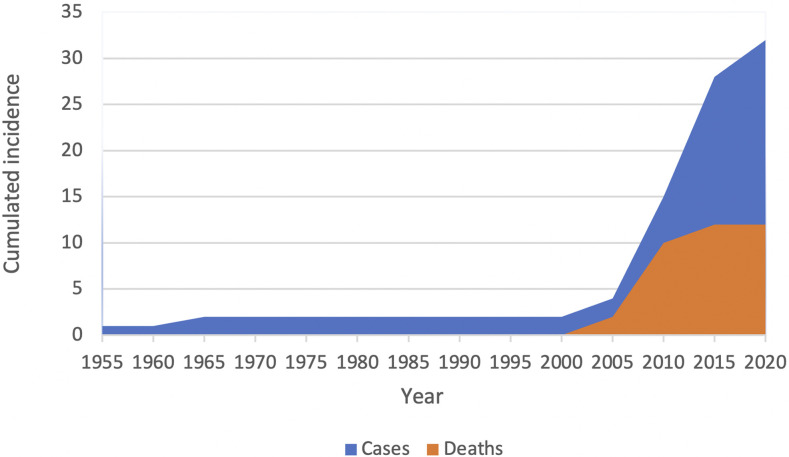
Figure 3.
Cumulated incidence of malaria cases and cardiovascular death. Cumulated reporting of malaria cases (blue) and cardiovascular death (orange) according to time period. Data are from the included case reports and series of cases. This figure appears in color at www.ajtmh.org.

