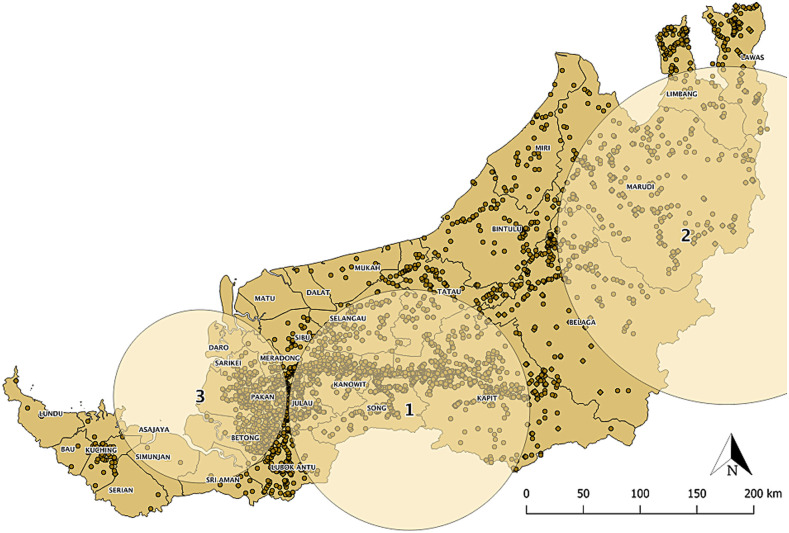
Figure 1.
Spatiotemporal clusters of knowlesi malaria from 2008 to 2017. Each dot on the map represents a case. These clusters were identified in time frames of December 2012–November 2017 (cluster 1), August 2012–July 2017 (cluster 2), and October 2017–December 2017 (cluster 3). This figure appears in color at www.ajtmh.org.

