Figure 1.
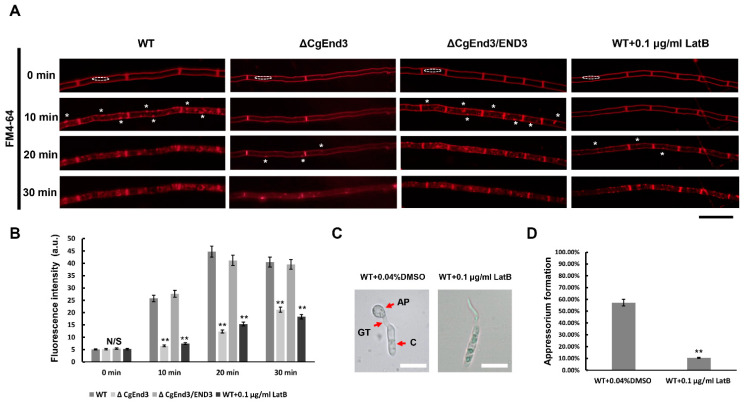
Involvement of CgEnd3 in endocytosis. (A) Hyphal block from wild type (WT), ΔCgEnd3, and ΔCgEnd3/END3 were inoculated on Potato Dextrose Agar (PDA)-coated glass slides and cultured at 25 °C. At 2 days post inoculation (dpi), hyphae were stained using 0.5 μM N-(3-triethylammoniumpropyl)-4-(p-diethylaminophenylhexatrienyl)-pyridinium 2Br (FM4-64), and images were photographed at different time points (0–30 min) using fluorescence microscope. In any case, hyphae from WT were treated with 0.1 μg/mL Latrunculin B (LatB) for 30 min. The dotted frame indicates the region of cytoplasm, and the fluorescence intensity at each time point was quantified using ImageJ software. The white asterisks indicate site of endocytosis. This experiment was repeated three times. Bars = 10 μm. (B) Bar chart showing the mean fluorescence intensity in cytoplasm of each strain at different time points. Data from at least ten hyphae were collected at each time points from each strain. Error bars represent the standard deviations. Data were analyzed using Duncan’s range test. Asterisks ** indicate statistically significant differences at p < 0.05. a.u., arbitrary units. (C) Conidial suspensions (105 conidia/mL) from WT were inoculated on the hydrophobic side of Gel-bond membrane, water drops were replaced by 30 μL, 0.1 μg/mL LatB at 3 hpi for 30 min, and the controls were treated with 0.04% dimethyl sulfoxide (DMSO). Each sample was washed with distilled water after treatment. Appressorium formation was imaged at 5 h post inoculation (hpi). This experiment was repeated three times. AP = appressorium. GT = germ tube. C = conidia. Bars = 10 μm. (D) Bar chart showing the rate of appressorium formation at 5 hpi. Error bars represent the standard deviations. Data were analyzed using Duncan’s range test. Asterisks ** indicate statistically significant differences at p < 0.05. N/S = difference not significant.

