Figure 2.
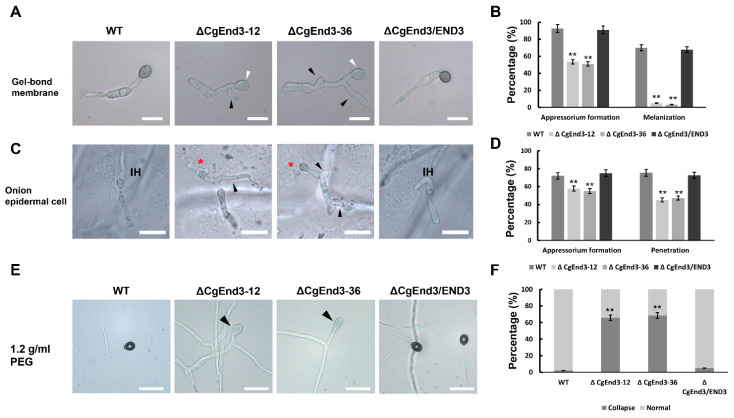
Appressorium formation, penetration and turgor pressure test. (A) Equal volumes (30 μL) of conidial suspensions (105 conidia/mL) from WT, ΔCgEnd3, and ΔCgEnd3/END3 were inoculated on the hydrophobic side of the Gel-bond membrane. Images were pictured at 9 hpi. White arrow indicates the nonmelanized appressorium. This experiment was repeated three times. Black arrow indicates the branched germ tube. Bars = 10 µm. (B) Bar chart showing the percentage of appressorium formation and melanization at 9 hpi in (A). Error bars represent the standard deviations. Data were analyzed using Duncan’s range test. Asterisks ** indicate a statistically significant differences at p < 0.05. (C) Appressorium formation and penetration of WT, ΔCgEnd3, and ΔCgEnd3/END3 on onion epidermal cell at 9 hpi. This experiment was repeated three times. IH = infection hyphae. Red asterisk indicates the stunted infection hyphae. Black arrow indicates the branched germ tube. Bars = 10 µm. (D) Bar chart showing the appressorium formation and penetration rate in WT, ΔCgEnd3, and ΔCgEnd3/END3 on onion epidermal cell at 9 hpi. Error bars represent the standard deviation. Data were analyzed using Duncan’s range test. Asterisks ** indicate statistically significant differences at p < 0.05. (E) The turgor pressure of appressorium from WT, ΔCgEnd3, and ΔCgEnd3/END3 were tested using 1.2 g/mL polyethylene glycol (PEG) 4000. Black arrow indicates the collapsed appressorium. This experiment was repeated three times. Bars = 10 µm. (F) Bar chart showing the percentage of normal or collapsed appressorium in WT, ΔCgEnd3, and ΔCgEnd3/END3 under the treatment of PEG 4000 for 10 min. Error bars represent the standard deviations. Data were analyzed using Duncan’s range test. Asterisks ** indicate statistically significant differences at p < 0.05.

