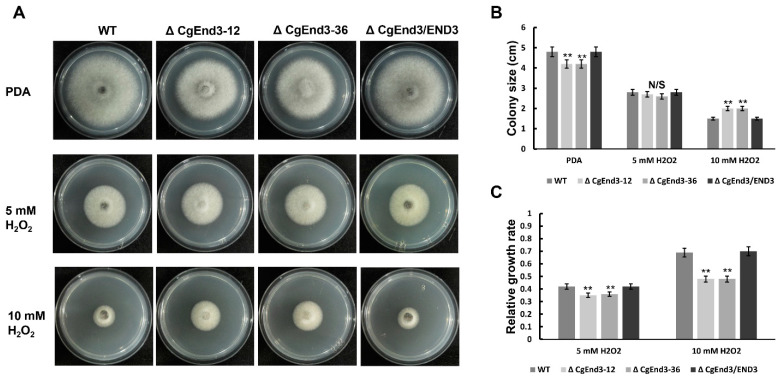
Figure 4.
Vegetative growth under oxidative stress. (A) Hyphal block from WT, ΔCgEnd3, and ΔCgEnd3/END3 were inoculated on PDA or PDA mixed with 5 and 10 mM H2O2, respectively. Images were pictured at 4 dpi. This experiment was repeated three times. (B) Bar chart showing the colony size of each strain on PDA and PDA mixed with 5 and 10 mM H2O2. Error bars represent the standard deviations. Data were analyzed using Duncan’s range test. Asterisks ** indicate statistically significant differences at p < 0.05. N/S = difference not significant. (C) Bar chart showing the relative growth rate of each strain on PDA mixed with 5 and 10 mM H2O2; computing methods of relative growth rate were described by Wang et al. [54]. The deceased relative growth rate indicates the increased resistance to stress and vice versa. Error bars represent the standard deviations. Data were analyzed using Duncan’s range test. Asterisks ** indicate statistically significant differences at p < 0.05.

