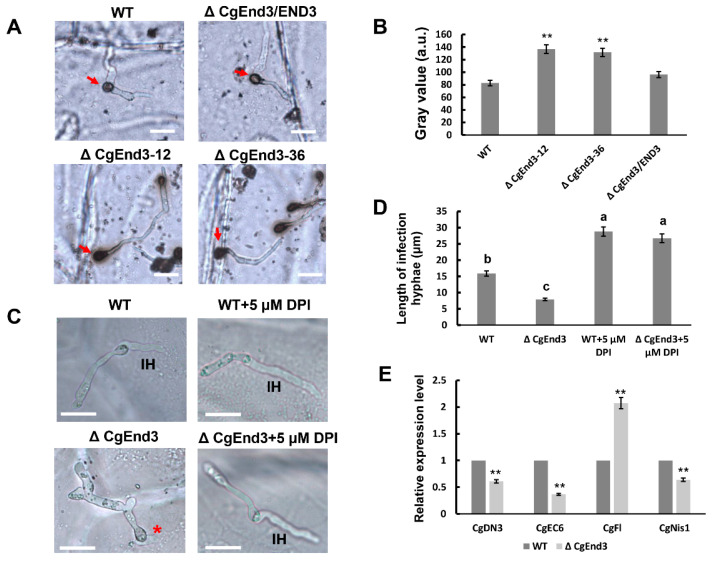
Figure 5.
CgEnd3 is involved in oxidant adaptation and expression of core effectors during the penetration of appressorium. (A) Equal volumes (30 μL) of conidial suspensions (105 conidia/mL) from WT, ΔCgEnd3, and ΔCgEnd3/END3 were inoculated on the hydrophobic side of onion epidermal cell. At 9 hpi, appressorium of each strain was stained using 2 mg/mL 3,3′-diaminobenzidine (DAB) solution in darkness for 12 h. Red arrow indicates the dark brown polymers in the presence of reactive oxygen species (ROS). This experiment was repeated three times. Bars = 10 µm. (B) The deposition of dark brown polymers was analyzed using ImageJ software, bar chart showing the gray value (a. u.) of each strain. Data were collected from at least 10 samples from each strain. Error bars represent the standard deviations. Data were analyzed using Duncan’s range test. Asterisks ** indicate statistically significant differences at p < 0.05. (C) Conidial suspensions (105 conidia/mL) from WT and ΔCgEnd3 were added with diphenyleneiodonium (DPI) at a final concentration of 5 μM. Images were photographed at 9 hpi. Red asterisk indicates the stunted infection hyphae. IH = infection hyphae. Bars = 10 µm. (D) Bar chart showing the mean length of infection hyphae from each sample. Data were collected from at least 20 infection hyphae, and this experiment was repeated three times. Error bars represent the standard deviations. The values indicated by the different letters are significantly different at p < 0.05, as determined using post hoc Tukey’s test. (E) Conidial suspensions (106 conidia/mL) from WT and ΔCgEnd3 were inoculated on poplar leaves. Inoculation areas (including fungal tissue and leaf tissue) were cut at 3 dpi, and 5 mg samples from WT and ΔCgEnd3 areas were collected. Bar chart showing the expression of conserved effectors in WT and ΔCgEnd3 during early stage of infection. This experiment was repeated three times. Error bars represent the standard deviations. Data were analyzed using Duncan’s range test. Asterisks ** indicate statistically significant differences at p < 0.05.

