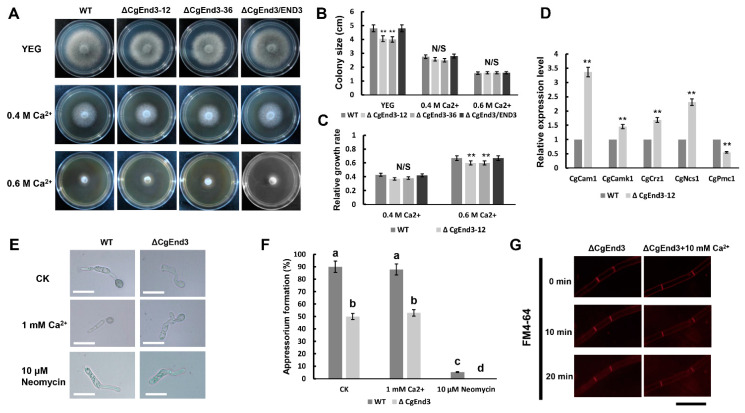
Figure 7.
Role of CgEnd3 in calcium signaling. (A) Hyphal block from WT, ΔCgEnd3, and ΔCgEnd3/END3 were inoculated on Yeast extract-glucose medium (YEG) and YEG containing 0.4 and 0.6 M Ca2+, respectively. Strains were cultured at 25 °C for 4 days. This experiment was repeated three times. (B) Bar chart showing the colony size of each strain on YEG and YEG containing 0.4 and 0.6 M Ca2+ in (A). Data were analyzed using Duncan’s range test. Asterisks ** indicate statistically significant differences at p < 0.05. N/S = difference not significant. (C) Bar chart showing the relative growth rate of each strain under the treatment of 0.4 and 0.6 M Ca2+. Error bars represent the standard deviations. Data were analyzed using Duncan’s range test. Asterisks ** indicate statistically significant differences at p < 0.05. N/S = difference not significant. (D) Bar chart showing the relative expression of five calcium signaling genes in WT and ΔCgEnd3. This experiment was repeated three times. Error bars represent the standard deviations. Data were analyzed using Duncan’s range test. Asterisks ** indicate statistically significant differences at p < 0.05. (E) The effects of exogenous 1 mM Ca2+ and 10 μM of the phospholipase C inhibitor neomycin on appressorium formation in WT and ΔCgEnd3 at 9 hpi. This experiment was repeated three times. Bars = 10 µm. (F) Bar chart showing the rate of appressorium formation under the treatment of 1 mM Ca2+ or 10 μM neomycin. Error bars represent the standard deviations. The values indicated by the different letters are significantly different at p < 0.05, as determined using post hoc Tukey’s test. (G) The internalization of FM4-64 in ΔCgEnd3 in the presence of 10 mM Ca2+. Images were photographed at different time points (0–20 min) using fluorescence microscope. Bars = 10 μm. This experiment was repeated three times.

