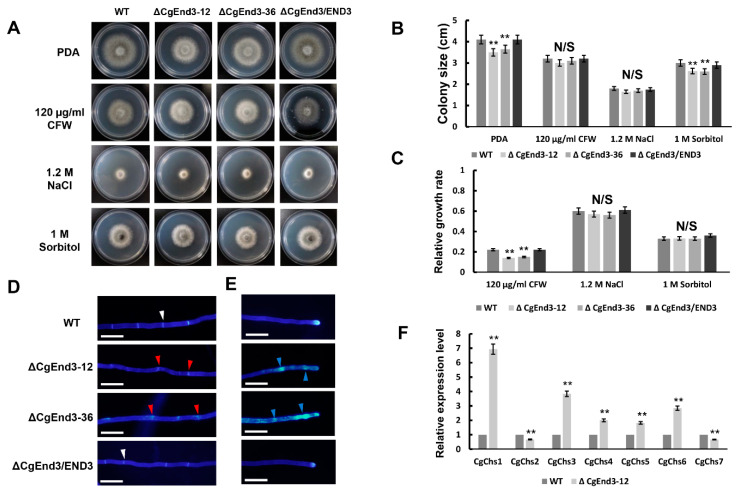
Figure 8.
Response to cell wall integrity agents and high osmotic stress, calcofluor white (CFW) staining of hyphae and relative expression of seven chitin synthase genes. (A) Vegetative growth of WT, ΔCgEnd3, and ΔCgEnd3/END3 on PDA and PDA containing 120 µg/mL CFW, 1.2 M NaCl, and 1 M sorbitol, respectively. Strains were cultured at 25 °C for 4 days. This experiment was repeated three times. (B) Bar chart showing the colony size of each strain in (A). Error bars represent the standard deviations. Data were analyzed using Duncan’s range test. Asterisks ** indicate statistically significant differences at p < 0.05. N/S = difference not significant. (C) Bar chart showing the relative growth rate of each strain in the presence of 120 µg/mL CFW, 1.2 M NaCl, and 1 M sorbitol, respectively. Error bars represent the standard deviations. Data were analyzed using Duncan’s range test. Asterisks ** indicate statistically significant differences at p < 0.05. N/S = difference not significant. (D) CFW staining of hyphal septa from WT, ΔCgEnd3, and ΔCgEnd3/END3. White arrow indicates the intact septum in WT. Red arrow indicates the dispersed chitin at septum. Bars = 10 µm. (E) CFW staining of hyphal tip from WT, ΔCgEnd3, and ΔCgEnd3/END3. Blue arrow indicates the punctiform pattern of chitin distribution at the hyphal tips. This experiment was repeated three times. Bars = 10 µm. (F) Bar chart showing the relative expression level of seven chitin synthase genes in WT and ΔCgEnd3. This experiment was repeated three times. Data were analyzed using Duncan’s range test. Asterisks ** indicate statistically significant differences at p < 0.05.

