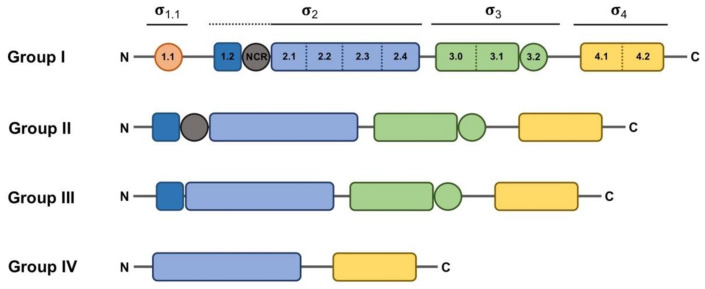
Figure 1.
Schematic representation of the domain and subdomain architecture present in the different groups of the σ70 family. Regions that do not have a direct interaction with DNA appear as circles. Domains σ1.1, core σ2, σ3 and σ4 appear in orange, blue, green and yellow, respectively. Subdomains σ1.2 and σNCR (non-conserved region), which are considered part of the σ2 domain but are not conserved in all σ70 family groups, are depicted in dark blue and gray, respectively, and indicated with a dotted line. The extent of the rest of the σ domains is indicated with solid lines.

