
Fig 6. Lack of exhaustion characteristics in graft TRM.
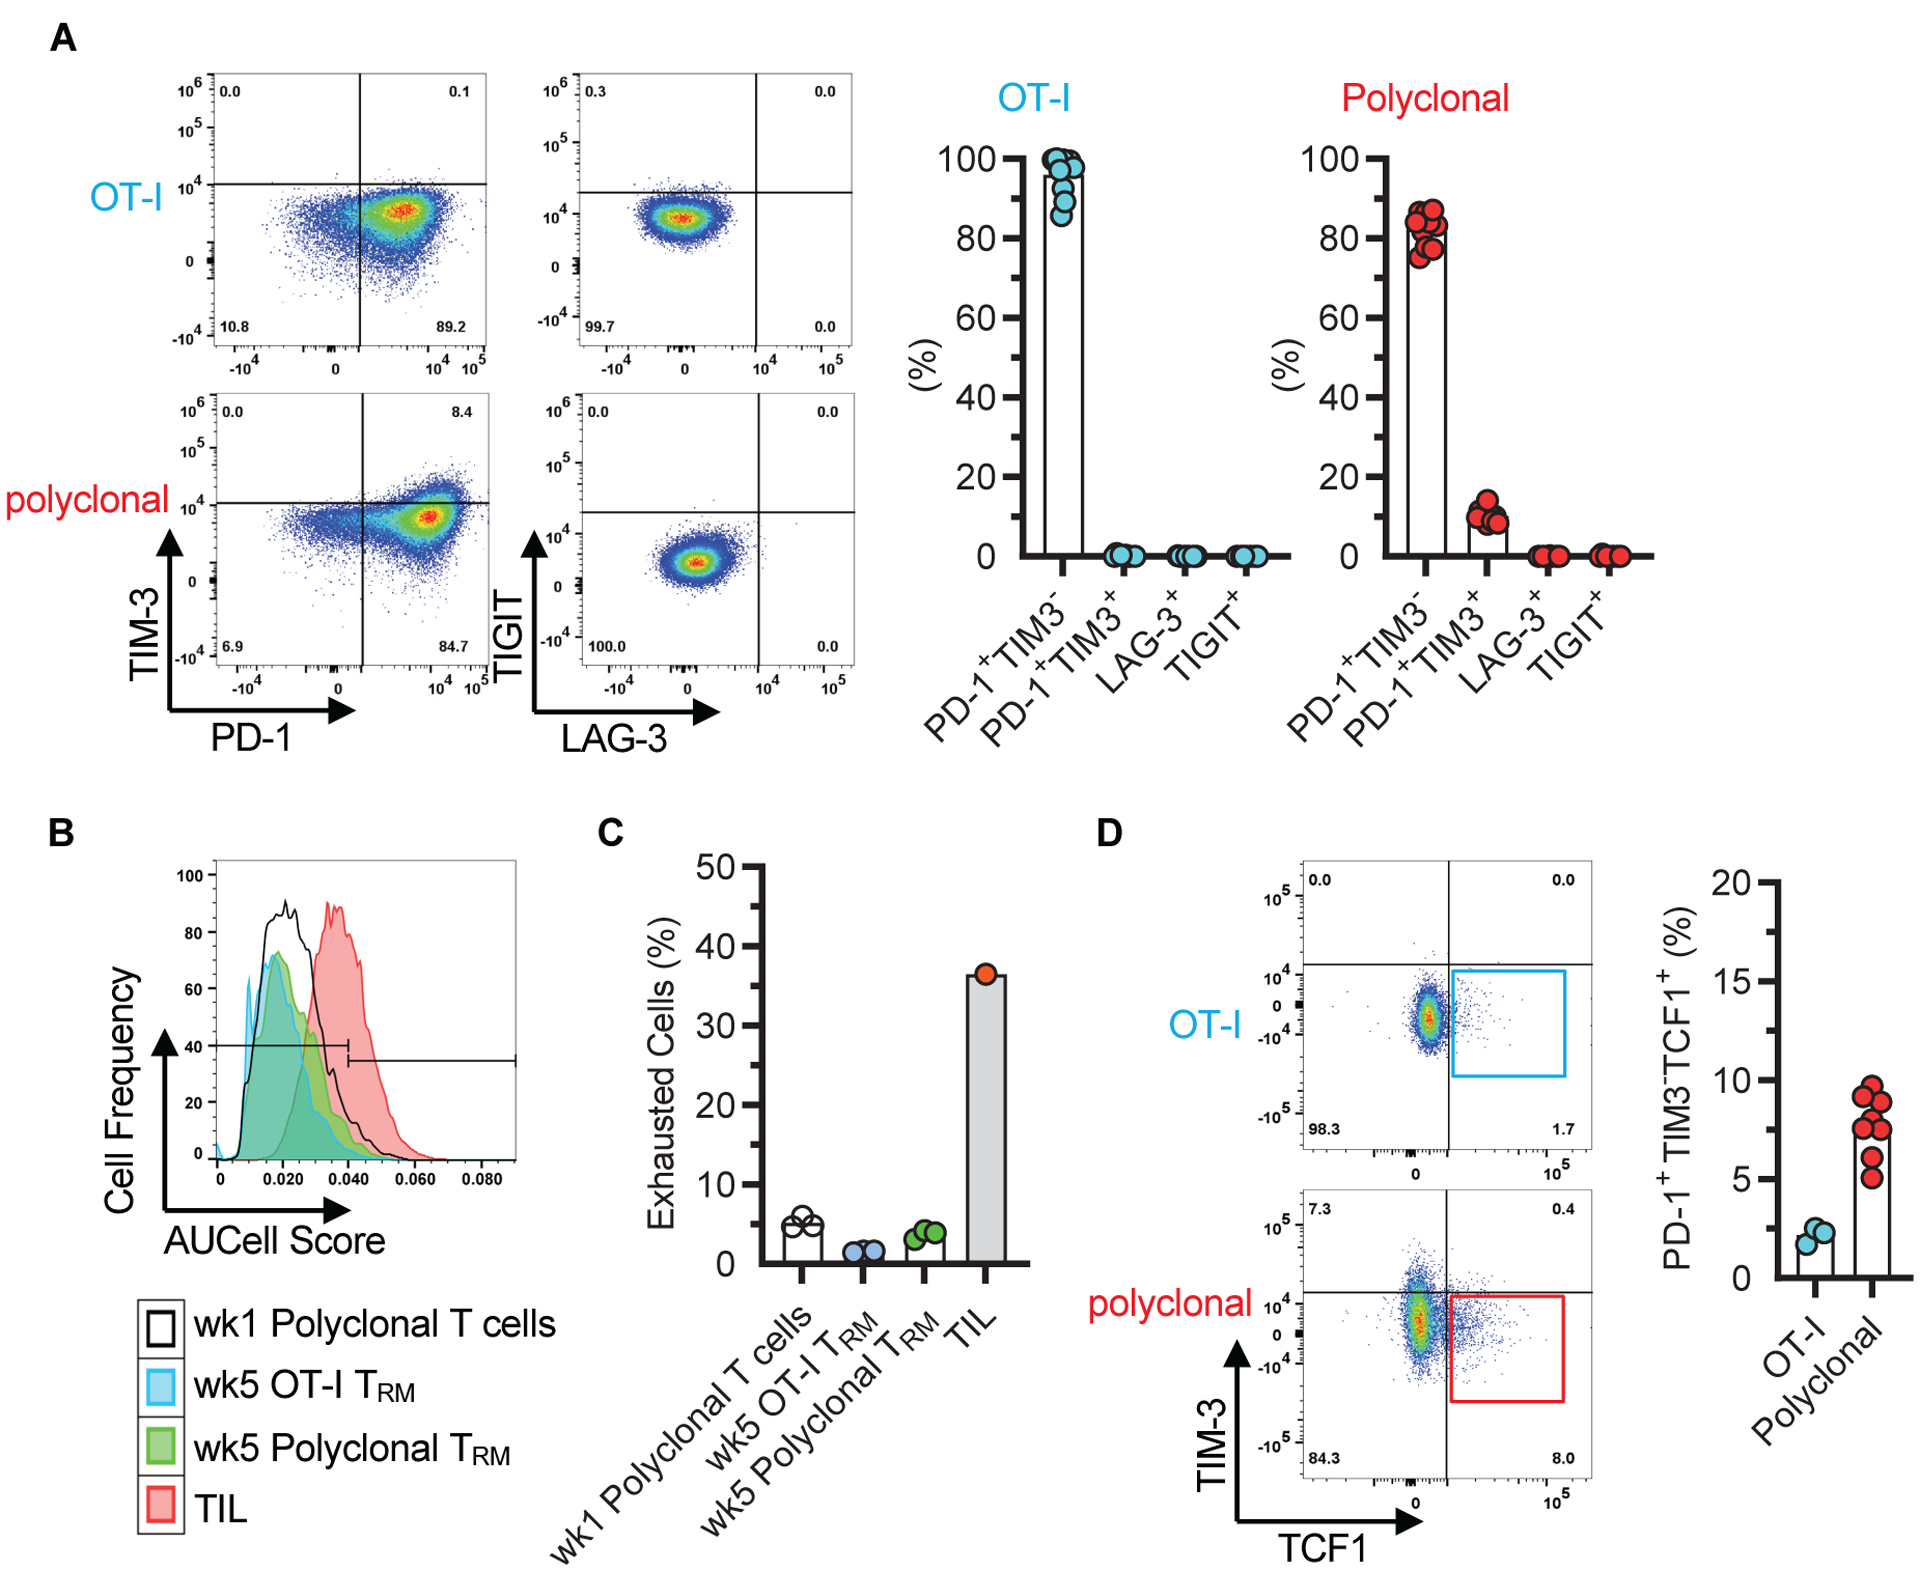
A, Representative flow cytometry panels depicting exhaustion marker expression on graft OT-I and polyclonal CD8+ T cells after gating on the CD44hiCD62LloCD69+ population 8 weeks after transplantation. Data shown in corresponding bar graphs are individual biological replicates and mean (n = 10, N = 4). B, Lack of enrichment for the exhaustion gene set (GSE9650) in week 5 graft OT-I and polyclonal TRM. Gene set enrichment was scored based on scRNAseq data of OT-I and CD8+ subset 2 depicted in Fig. 3. Enrichment of exhaustion gene set in tumor infiltrating lymphocytes (TIL) and in week 1 polyclonal graft T cells are included as positive and negative controls, respectively. C, Quantitative representation of data shown in B, individual biological replicates and mean (n = 3 except for TIL (n = 1), N = 1). D, Representative flow cytometry panels showing the proportion of graft OT-I and polyclonal CD8+ T cells that are TIM3−TCF1+ after gating on the CD44hiCD62LloCD69+PD-1+ population at 4 – 10 weeks after transplantation. Data are individual biological replicates and mean (n = 3 and N = 2 for OT-I, n = 8 and N = 3 for polyclonal).