
Fig 7. A common T cell tissue residency program.
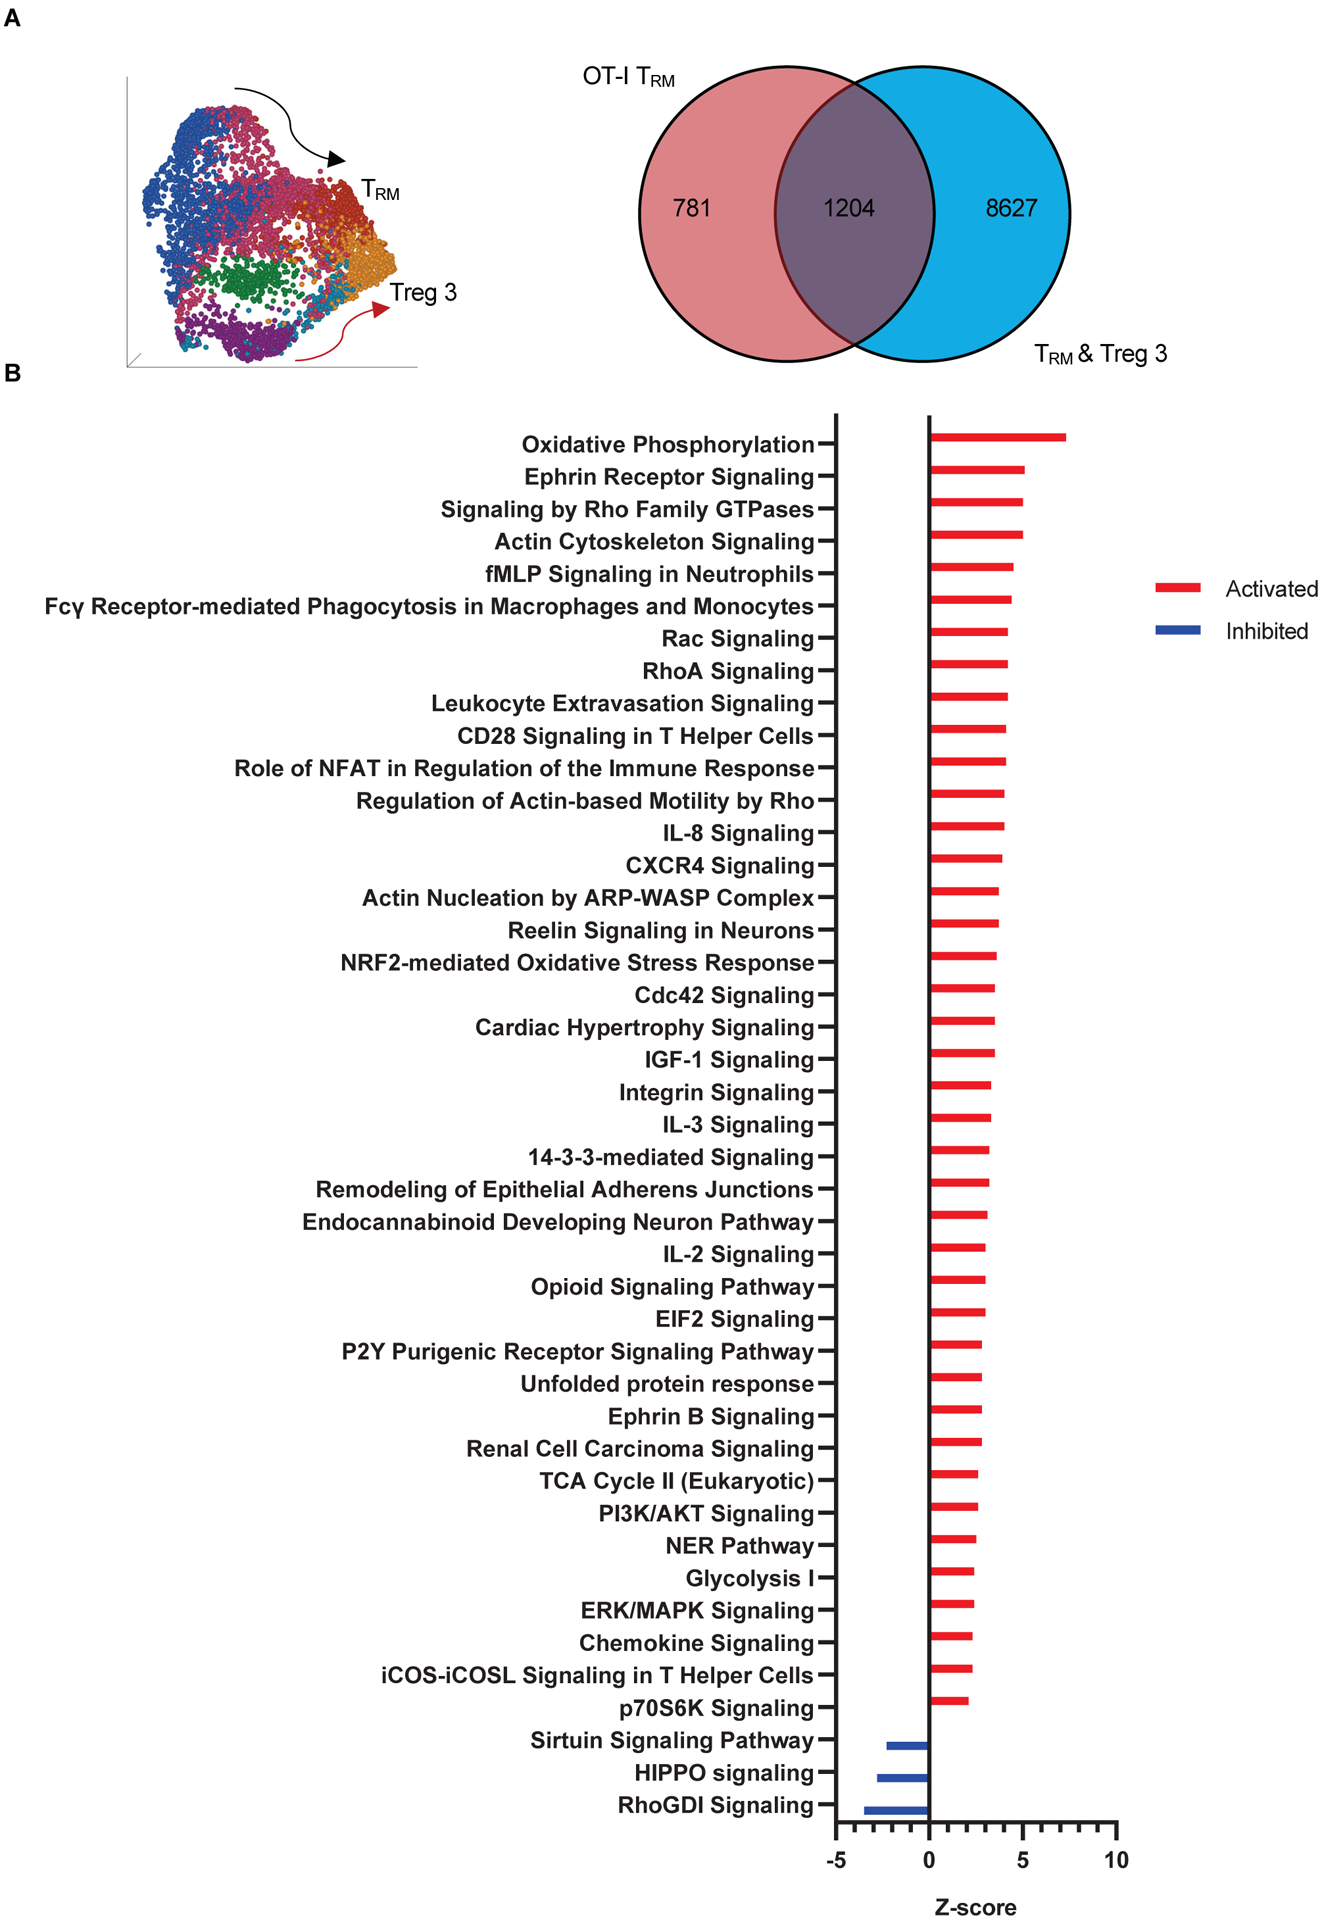
A, Venn diagram illustrating the number of genes shared between DEG of OT-I TRM and non-DEG of polyclonal TRM and CD4+Foxp3+ regulatory subset 3 (Treg 3) depicted in UMAP on left and in Fig. 3E. B, Ingenuity Pathway Analysis of the shared gene set. Pathways listed were identified as significant based on −log(BH p-value)>1.3, ratio>0.1, z-score>[2].