Figure 7.
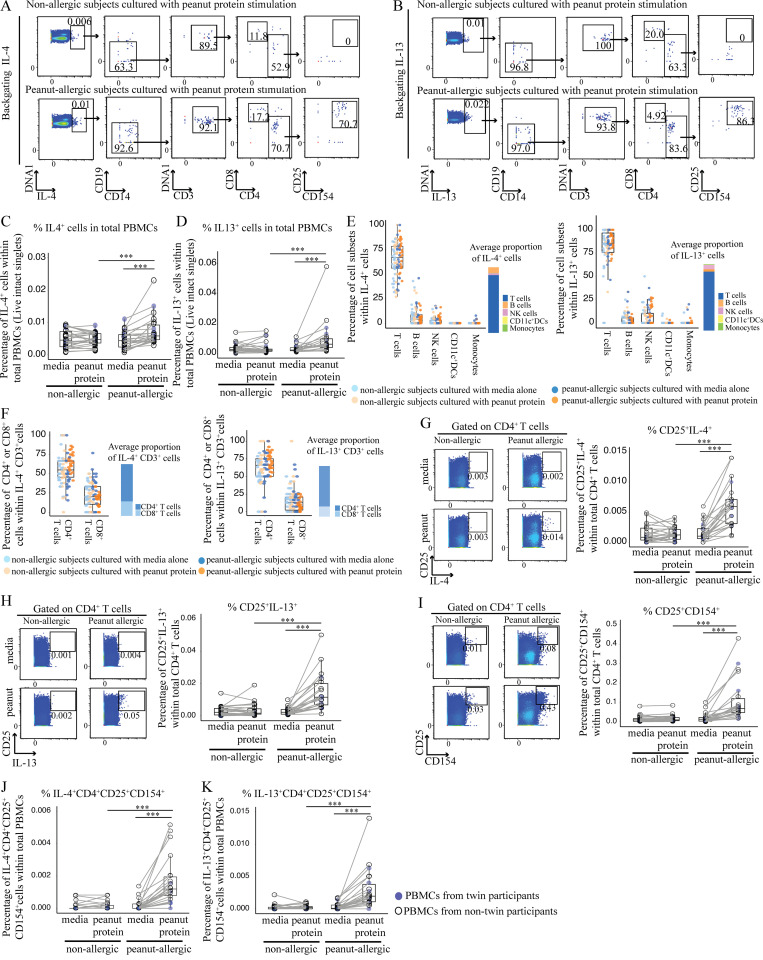
T cells are the major source of IL-4 and IL-13 responsible for monocyte and DC differentiation following peanut protein stimulation. (A and B) Representative mass cytometry plots showing CD4+ activated T cells as measured by CD25 and CD154 expression, identified by backgating from IL4+ cells (A) and IL-13+ cells (B) for one NA and one PA participant. (C and D) Percentage of IL-4+ (C) and IL-13+ (D) cells per total PBMCs incubated with or without peanut protein for NA versus PA participants. (E and F) Percentage of different cell types (T cells, B cells, natural killer cells, CD11c+ DCs, and monocytes) in IL-4+ cells (left) or IL-13+ cells (right; E). Percentage of CD4+ and CD8+ T cells in IL-4+CD3+ T cells (left) or IL-13+CD3+ T cells (right; F). Each dot represents a single subject color-coded according to allergic status and peanut protein stimulation status. NK, natural killer. (G–I) Left: Representative mass cytometry plots show the effect of peanut protein on CD4+ T cells for the expression of CD25 and IL-4 (G), IL-13 (H), or CD154 (I) for one NA and one PA participant. Right: Percentage of CD25+IL-4+ (G), CD25+IL-13+ (H), and CD25+CD154+ (I) CD4+ T cells for PBMCs from NA and PA participants incubated with or without peanut protein. (J and K) Mass cytometry backgating based on IL-4 and IL-13: Percentage of IL-4+CD25+CD154+CD4+ T cells (J) and IL-13+CD25+CD154+CD4+ T cells (K) per total PBMCs incubated with or without peanut protein for NA versus PA participants. Box plots in C, D, and G–K represent IQR and median; whiskers extend to the farthest data point within a maximum of 1.5× IQR. Blue circles represent twin participants (n = 6 for each group); open circles represent nontwin participants (NA, n = 20; PA, n = 16). Each pair of points connected by a line represents one subject. Paired sample sets were analyzed using the Wilcoxon signed rank test (two sided). Unpaired sample sets were analyzed using the Wilcoxon rank sum test (two sided). ***, P < 0.001.

