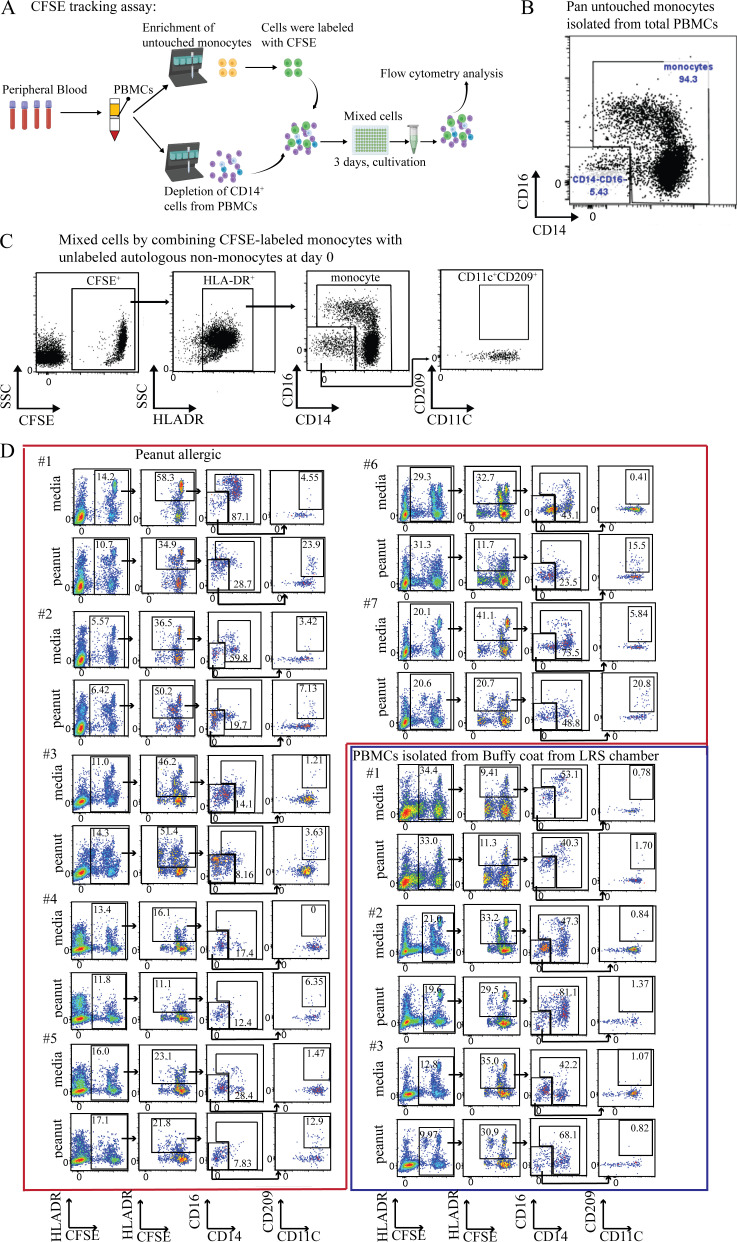
Figure S3.
Schematic overview and flow cytometry plots showing the CFSE-based assay for tracking monocyte changes in response to peanut protein for PA subjects. (A) Schematic overview of the CFSE-based monocyte tracking assay. (B) Representative flow cytometry plots showing the purity of isolated untouched monocytes using Miltenyi pan monocytes isolation kit. (C) Representative flow cytometry plots show the CFSE+CD209+CD11c+ DCs in the mixed cells by combining CFSE-labeled monocytes and unlabeled autologous nonmonocytes before incubation with peanut proteins. (D) Flow cytometry plots gated on Lin (CD3, CD19, CD56) negative cells show the change of CFSE+ monocytes and CFSE+CD209+CD11c+ DCs by peanut protein from the PBMCs stimulated with or without peanut protein in seven PA participants and three healthy buffy coats.

