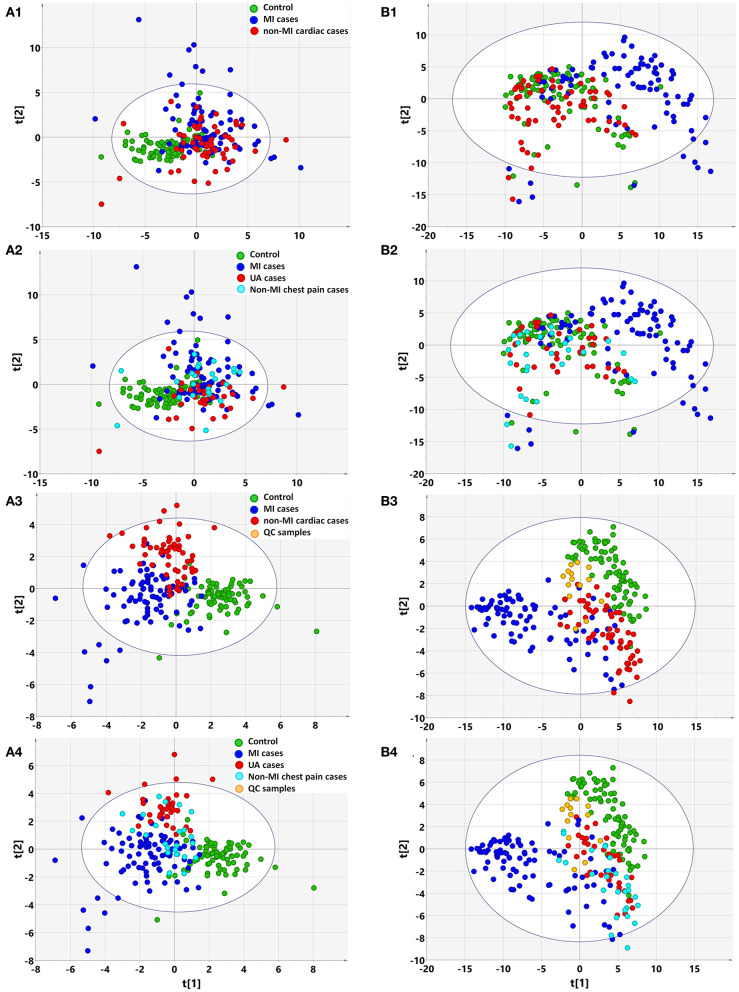
Figure 1.
Multivariate statistical analysis differentiates the groups of myocardial infarction (MI) cases, non-MI chest pain cases, and controls based on clinical information (A) and metabolomic data (B), respectively. (1) Non-supervised PCA modeling displays the original similarity of the three groups: MI cases (n = 85), non-MI chest pain cases (n = 61), and controls (n = 84), without arbitrary grouping. (2) Non-supervised PCA modeling displays the original similarity of the four groups: MI cases, unstable angina (UA), other non-MI cardiac cases, and controls, without arbitrary grouping. (A1,A2) PC1: R2X(cum) = 0.0895, Q2(cum) = 0.0106; PC2: R2X(cum) = 0.167, Q2(cum) = 0.0356. (B1,B2) PC1: R2X(cum) = 0.205, Q2(cum) = 0.189; PC2: R2X(cum) = 0.310, Q2(cum) = 0.274; PC3: R2X(cum) = 0.386, Q2(cum) = 0.338. (3) Supervised PLS-DA modeling with the three groups: MI cases, non-MI chest pain cases, and controls. (A3) PC1: R2X(cum) = 0.073, R2Y(cum) = 0.339, Q2(cum) = 0.270; PC2: R2X(cum) = 0.128, R2Y(cum) = 0.544, Q2(cum) = 0.362; PC3: R2X(cum) = 0.174, R2Y(cum) = 0.635, Q2(cum) = 0.394. Permutation tests with the intercepts of R2 < 0.23, Q2 < −0.20. (B3) PC1: R2X(cum) = 0.184, R2Y(cum) = 0.215, Q2(cum) = 0.207; PC2: R2X(cum) = 0.249, R2Y(cum) = 0.400, Q2(cum) = 0.377; PC3: R2X(cum) = 0.315, R2Y(cum) = 0.547, Q2(cum) = 0.512. Permutation tests with the intercepts of R2 < 0.10, Q2 < −0.05. (4) Supervised PLS-DA modeling with the four groups: MI cases (n = 85), UA (n = 34), other non-MI cardiac cases (n = 27), and controls (n = 84). (A4) PC1: R2X(cum) = 0.073, R2Y(cum) = 0.259, Q2(cum) = 0.198; PC2: R2X(cum) = 0.132, R2Y(cum) = 0.397, Q2(cum) = 0.269; PC3: R2X(cum) = 0.173, R2Y(cum) = 0.492, Q2(cum) = 0.289. Permutation test with the intercepts of R2 < 0.180, Q2 < −0.15. (B4) PC1: R2X(cum) = 0.183, R2Y(cum) = 0.169, Q2(cum) = 0.163; PC2: R2X(cum) = 0.254, R2Y(cum) = 0.300, Q2(cum) = 0.277; PC3: R2X(cum) = 0.317, R2Y(cum) = 0.422, Q2(cum) = 0.387. Permutation test with the intercept of R2 < 0.11, Q2 < −0.05.

