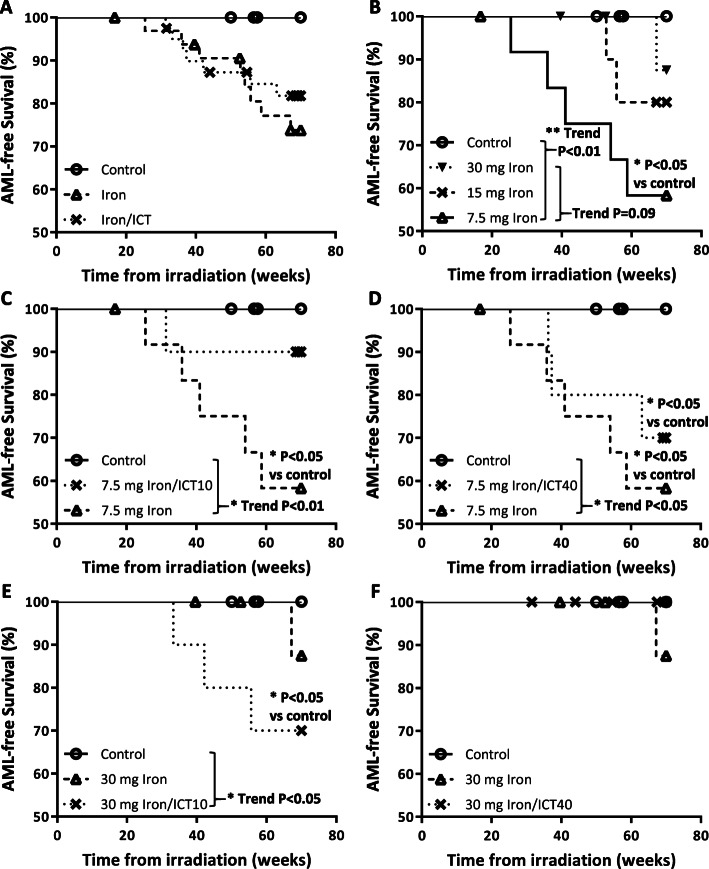
Fig. 2.
Kaplan-Meier (KM) AML-free survival curves. a Control group (Iron/ICT: 0/0) versus aggregated iron injected groups (7.5/0, 15/0, 30/0) and aggregated iron/ICT treatment groups (7.5/10, 7.5/40, 30/10 and 30/40). b Control (0/0) and iron injected groups (7.5/0, 15/0, 30/0). c Low iron and low ICT (0/0, 7.5/0, 7.5/10). d Low iron and high ICT (0/0, 7.5/0, 7.5/40). e High iron and low ICT (0/0, 30/0, 30/10). d High iron and high ICT (0/0, 30/0, 30/40). Statistical significance of treatment vs control was established using Mantel-Cox test. Trend analysis was established using Logrank test for trend according to order listed in the legend of each chart

