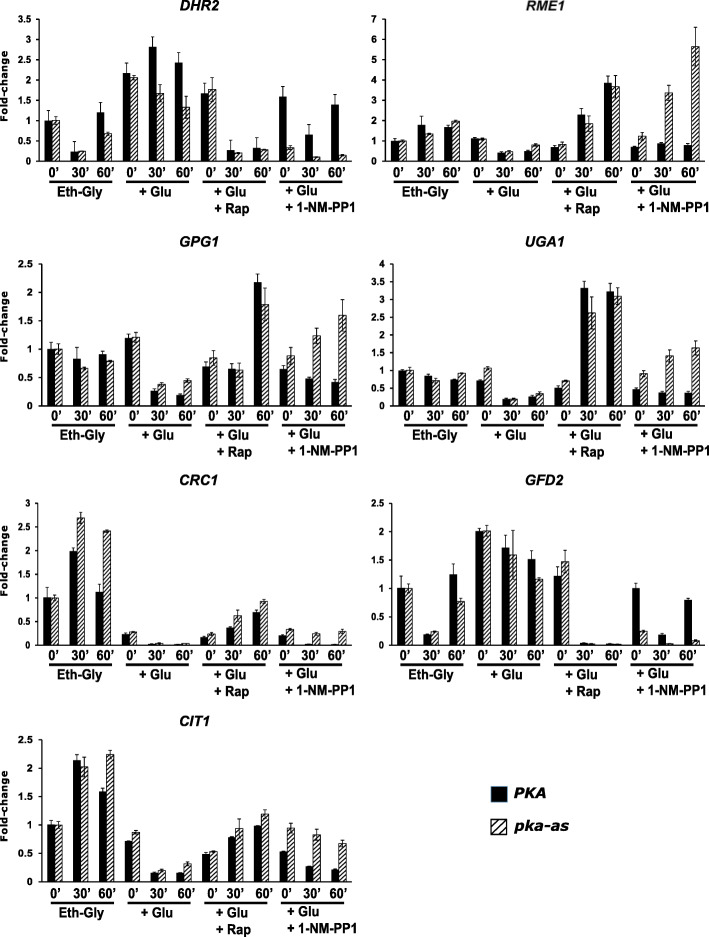
Fig. 4.
TORC1 and PKA co-regulate the transcriptional response to glucose. Wild type (PKA) and pka-as cells were grown to logarithmic phase were grown to logarithmic phase in SC/EG medium and then glucose (2% final concentration) was added in the presence of either rapamycin (200 nM) or 1-NM-PP1 (1.5 μM) or DMSO. Aliquots of the cultures were taken after 0, 30’, and 60’. RNA was extracted from the cultures, and the expression of the indicated 7 TGC genes were analyzed by real-time qRT-PCR. Data are presented as means ± standard deviation (n = 2 technical replicates). Data from two additional biological replicates of this experiment are presented in Fig. S3

