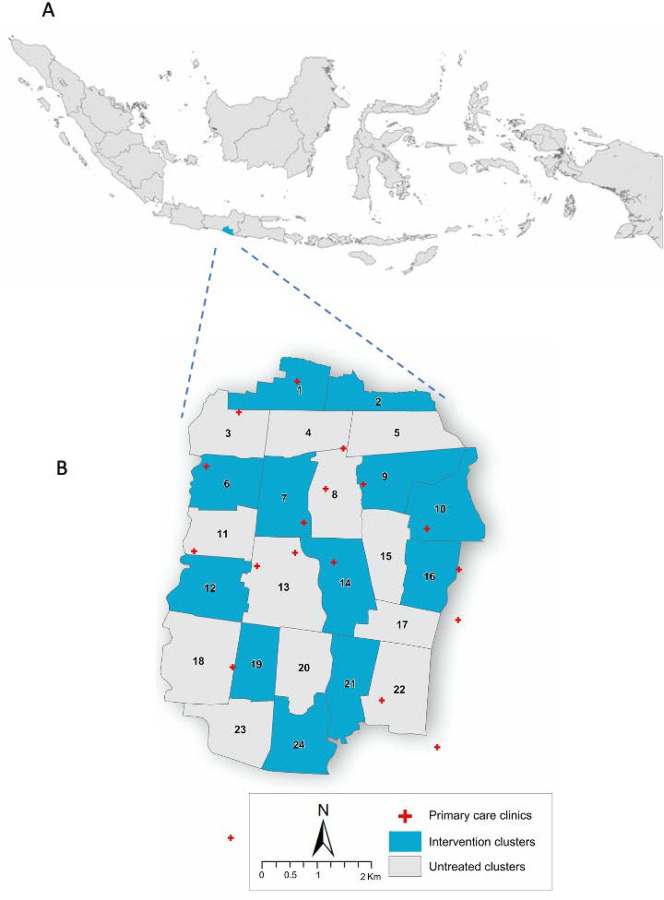
Figure 1: Map of study location.
In panel A, the map of Indonesia is shown with the Special Region of Yogyakarta shaded blue. In panel B, the map of Yogyakarta City (plus a small region of neighbouring Bantul District) is shown with wMel intervention clusters (shaded blue) and untreated clusters (shaded grey) indicated. The locations of primary care clinics (red crosses) where enrolment occurred are also shown.

