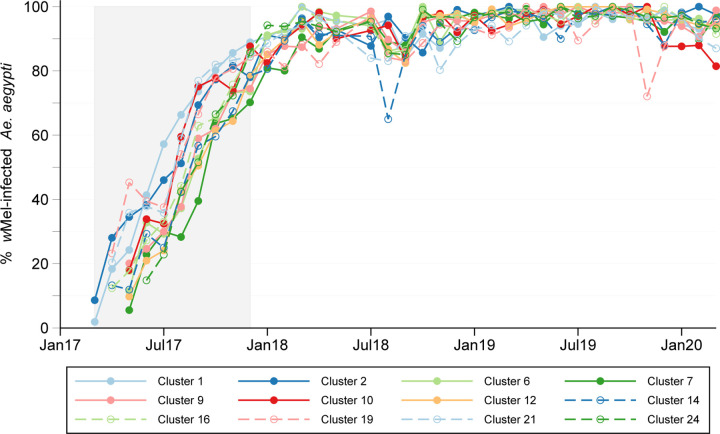
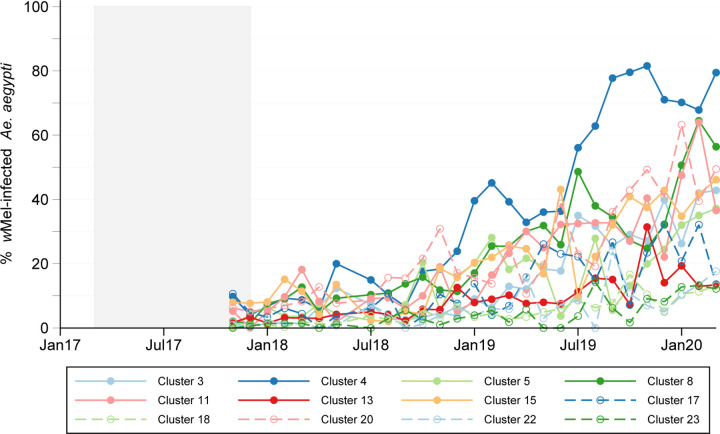
Figure 2: wMel introgression into local Aedes aegypti mosquito populations.
Lines show the percentage of Ae. aegypti collected from intervention clusters (A) and untreated clusters (B) that were wMel infected, each month from the start of deployments (March 2017) to the end of participant enrolment (March 2020). The shaded area indicates the period from the first release in the first cluster (March 2017) to the last release in the last cluster (December 2017). There were between 9 and 14 fortnightly release rounds per cluster.


