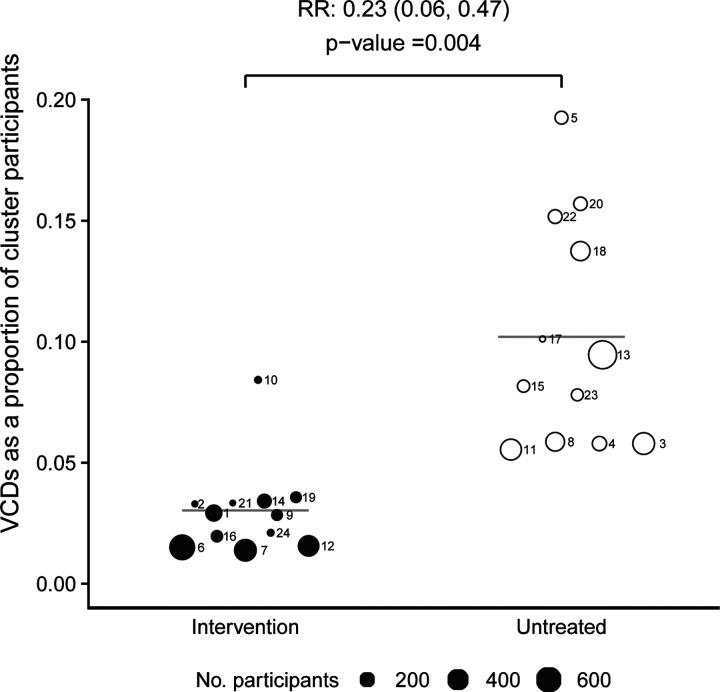
Figure 5: Cluster-level proportions of virologically-confirmed dengue cases.
VCD cases as a proportion of all participants in Wolbachia-treated (closed circles) and untreated (open circles) clusters. Circle size is proportionate to the total number of participants in the cluster. Circles are labelled with their respective cluster number. Horizontal bars show the mean VCD proportion in intervention and untreated clusters; the relative risk and P-value are derived from a comparison of these mean proportions (see Methods).

