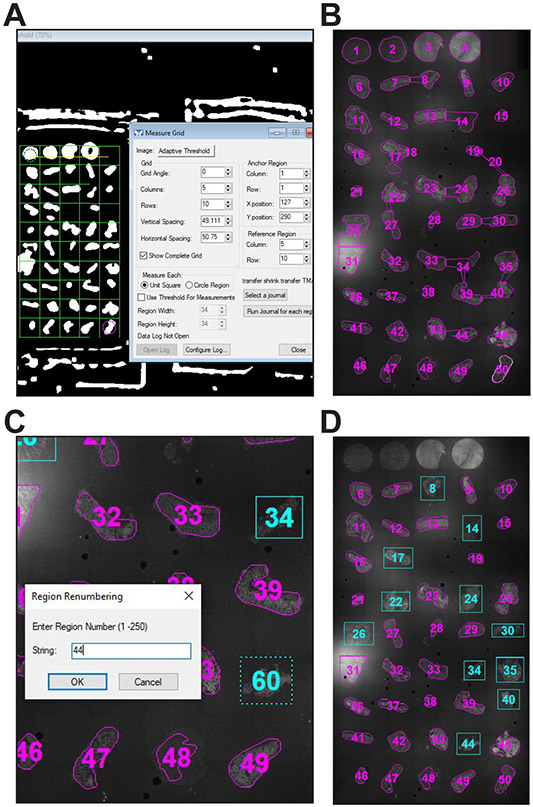
Figure 4. Placing ROIs.
A. Pressing the “Segment ROIs” button on the taskbar will display an adaptively thresholded image along with a measurement grid. B. ROIs are drawn automatically after the grid is positioned and the “Run Journal for each region” button is pressed. C. Some ROIs, e.g., 8, 24, and 34, include excess area and others, e.g., 20, have outlined artifacts. After placing new ROIs (shown in cyan), the new ROIs are renumbered to maintatin the sequence. D. Representative final ROI set (for slide 1).

