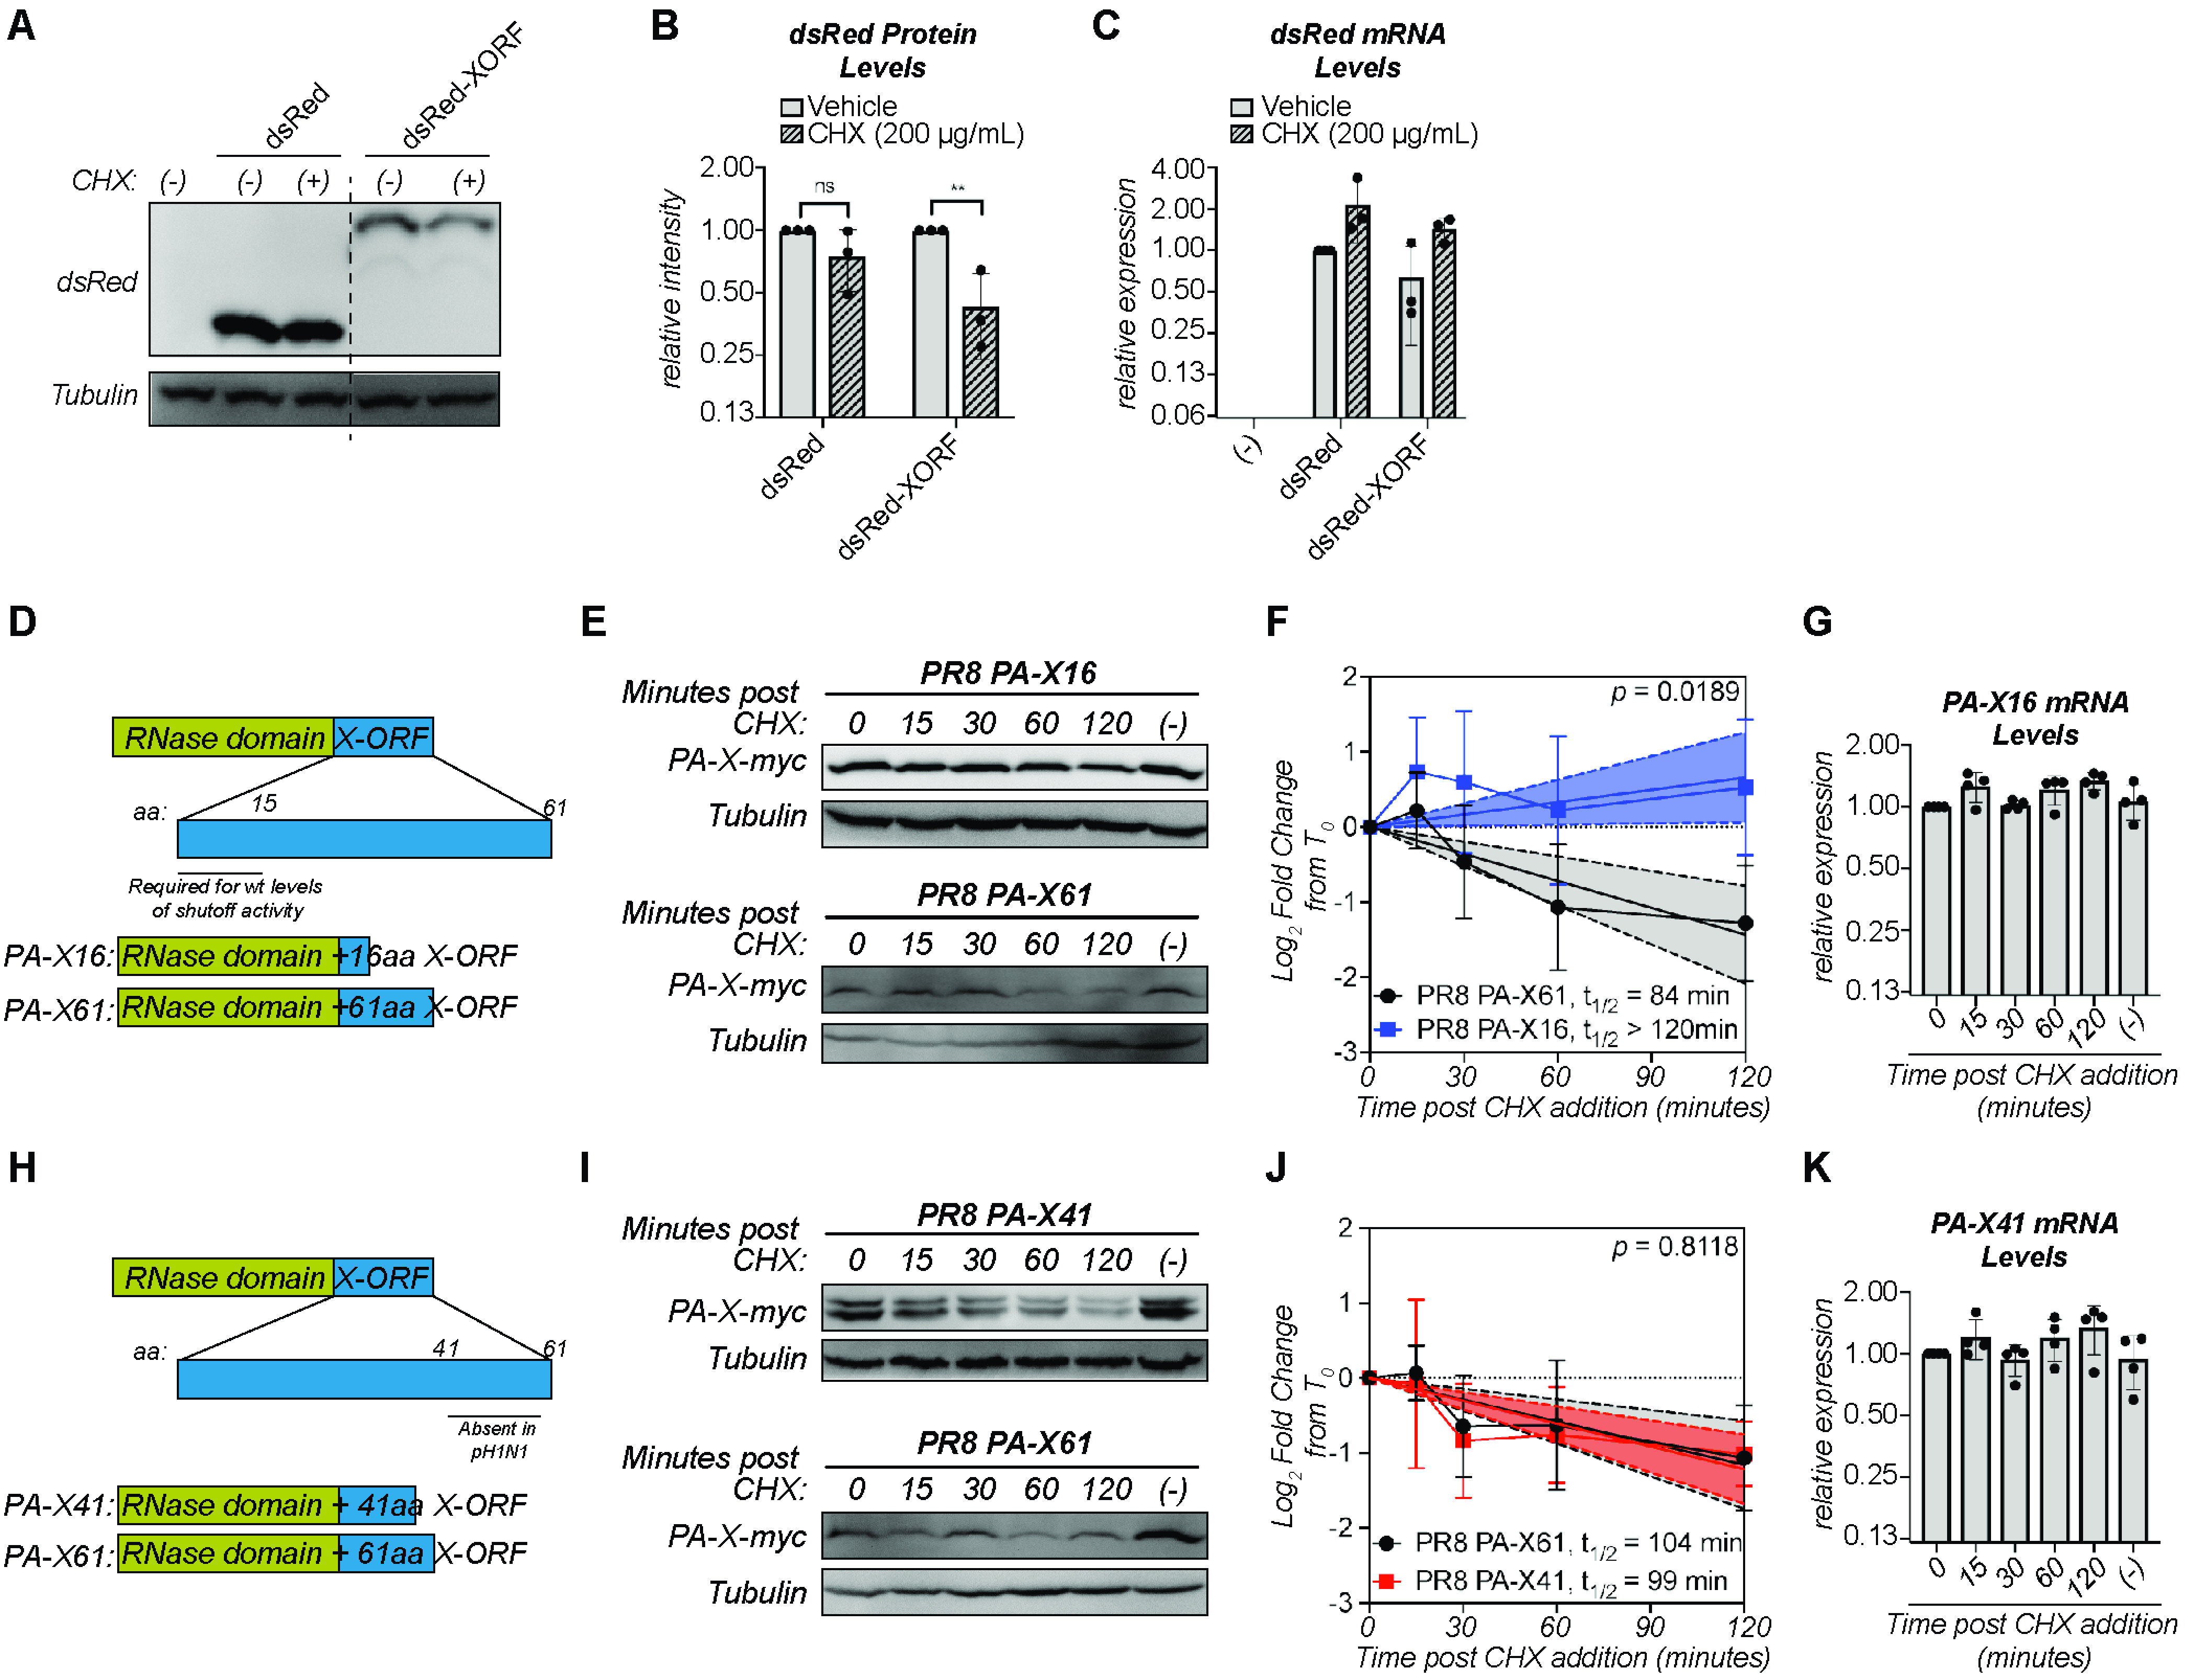
FIG 4.

Amino acids 17 to 41 of the X-ORF contribute to regulation of PA-X turnover. (A to C) Protein and RNA samples were collected from HEK293T cells expressing the indicated dsRed variant 6 hours after treatment with 200 μg/ml of cycloheximide (CHX) to inhibit translation (+) or vehicle control (−). (A) Representative Western blot using anti-dsRed antibodies to detect dsRed and tubulin as a loading control. (B) For each replicate, dsRed protein levels were normalized to tubulin protein levels and reported as the amount normalized to vehicle control for each dsRed variant. **, P < 0.01; ns, P > 0.05; 2-way ANOVA followed by Sidak’s multiple-comparison test. n = 3. (C) Levels of dsRed mRNA were measured by RT-qPCR. After normalization to 18S rRNA, levels were plotted as amounts relative to dsRed vehicle control. n = 3. (D, H) Schematic diagram of PA-X domains and PR8 PA-X16 (D) or PR8 PA-X41 (H) truncations used. (E to G, I to K) Protein and RNA samples were collected from HEK293T cells expressing the catalytically inactive full-length or the indicated truncated C-terminal myc-tagged PA-X at the indicated time points after treatment with 200 μg/ml of cycloheximide (CHX) to inhibit translation. (−) indicates vehicle-treated cells collected at 120 minutes. (E, I) Representative Western blots using anti-myc antibodies to detect myc-tagged PA-X and tubulin as a loading control. (F, J) Plots of the relative levels of PA-X after cycloheximide treatment. For each replicate, PA-X protein levels were normalized to tubulin protein levels and reported as the log2-transformed ratio from time zero. A linear regression was performed for each data set and the P value calculated relative to PR8 PA-X61 (full-length PA-X). The lines represent the linear regression, and the shaded regions indicate the 95% confidence interval (F: PA-X61: slope = −0.72, confidence interval = −1.05 to −0.39; PA-X16: slope = 0.33, confidence interval = 0.03 to 0.63; J: PA-X61: slope = −0.58, confidence interval: −0.87 to −0.28; PA-X41: slope = −0.61, confidence interval = −0.84 to −0.38). The half-lives (t1/2) were calculated as the negative inverse of the slope and are reported in minutes. As the slope for PA-X16 is positive, the half-life of this protein cannot be calculated and is therefore reported as longer than the time course of the experiment. n ≥ 3. (G, K) Levels of the mRNAs for the indicated truncated PA-X were measured by RT-qPCR. After normalization to 18S rRNA, levels were plotted as amounts relative to time zero. n > 3.
