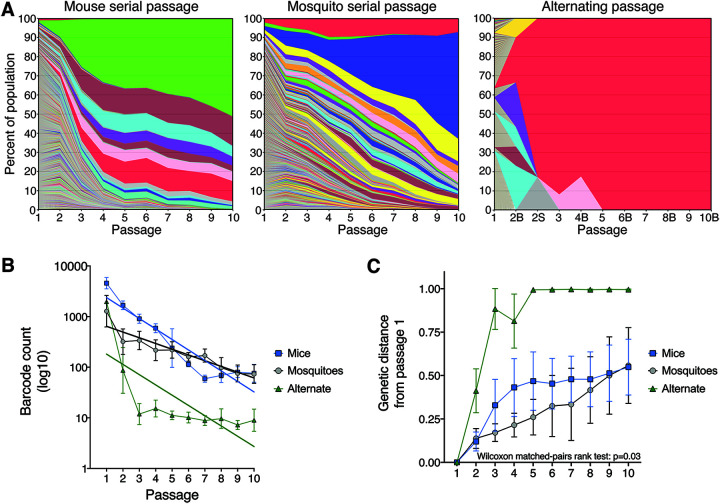
FIG 3.
ZIKV barcode dynamics over sequential passages. (A) Individual barcode frequencies over 10 serial or alternating passages. Composite images for each passage series were generated by ranking barcodes from most to least frequent and calculating the mean frequency of the barcodes at each rank across the five replicate lineages. Colors represent barcode rank and are not associated with the barcode sequence. Thus, each colored bar is the mean frequency of barcodes with the same rank in the five replicate lineages. In the alternating passage series, even passages are labeled “B” or “S” to differentiate mosquito bodies and saliva, respectively. (B) Barcode abundance over sequential passages. Solid lines are linear regression lines of best fit. (C) Euclidean distance of barcode populations relative to populations at passage 1. Values ranging from 0 to 1 indicate degree of genetic similarity, with lower values indicative of high similarity and vice versa. Wilcoxon matched-pairs rank test result was reported for comparison between serial mouse and serial mosquito passage.

