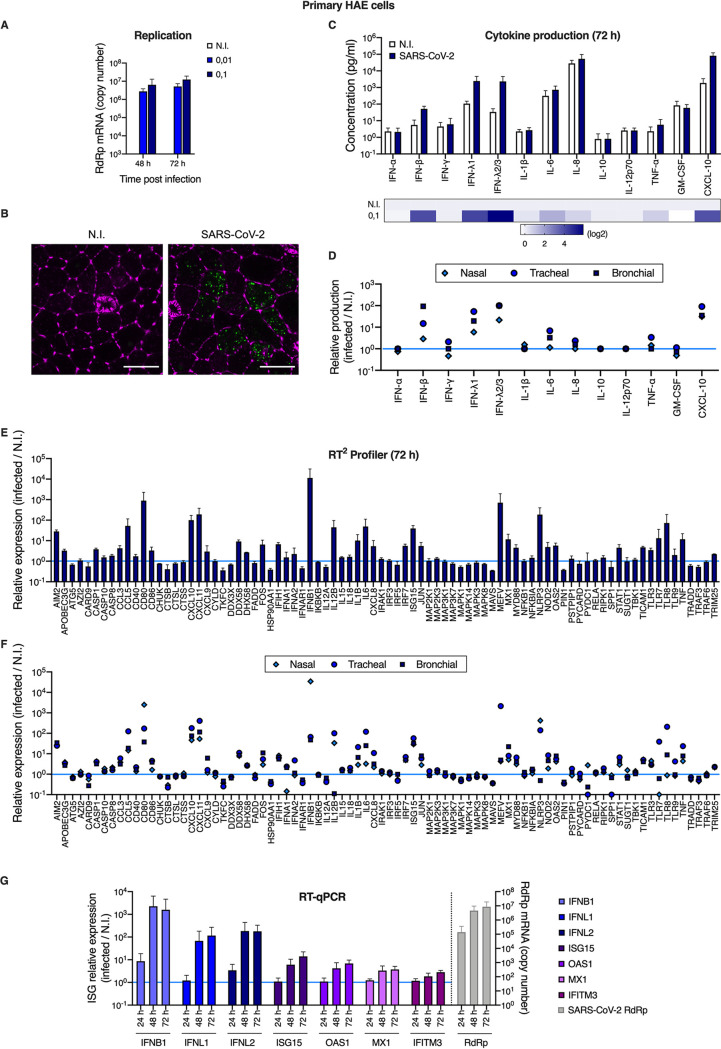
FIG 1.
Primary human airway epithelial host cell responses to SARS-CoV-2 infection. (A) Human HAE cells (MucilAir, Epithelix) were noninfected (N.I.) or incubated with SARS-CoV-2 on the apical side at MOIs of 0.01 and 0.1 for 2 h. Cells were harvested and lysed for RNA extraction and RT-qPCR analysis using RdRp primers and probe at 48 h and 72 h postinfection. (B) Human HAE cells were N.I. or incubated with SARS-CoV-2 on the apical side at MOI 0.1 for 2 h. After 48 h, cells were stained for actin with phalloidin (magenta) and an anti-double-stranded RNA antibody (green). Representative images, acquired with an LSM880 Airyscan microscope, are shown; scale bar 10 μm. (C) Human HAE cells were N.I. or incubated with SARS-CoV-2 (MOI 0.1), as in (A). Cytokine concentrations in the basal medium were measured using the human antivirus response panel LEGENDplex at 72 h after infection (top), and the heat map (bottom) represents the fold difference in cytokine concentrations (log2 scale) in basal media from infected compared to N.I. cells. (D) Data from human antivirus response panel LEGENDplex as performed in (C), with supernatants from cells of nasal, tracheal, and bronchial origins. (E) An antiviral response RT2 profiler PCR array analysis was performed using the RNAs from (A) extracted at 72 h (N.I. and MOI 0.1). Relative expression is shown for the indicated genes. (F) Data from antiviral response RT2 profiler PCR array analysis as in (D) obtained with RNAs from HAE cells of nasal, tracheal, and bronchial origins. (G) Human HAE cells were mock infected (N.I.) or incubated with SARS-CoV-2 on the apical side at MOI 0.01 for 2 h, harvested at the indicated time points, and lysed for RNA extraction and RT-qPCR. Differential ISG expression was measured using the indicated taqmans, and data were normalized to both ActinB and GAPDH (left y axis), while viral replication was analyzed using RdRp primers and probe (right y axis). The light blue line (sets at 1) indicates no change in cytokine production or in gene expression (D, E, F, and G). The means of four (A), three (C to F), or six (G; apart from the 24-h time point, for which n = 3) independent experiments are shown, with error bars representing the standard deviation (SD).

