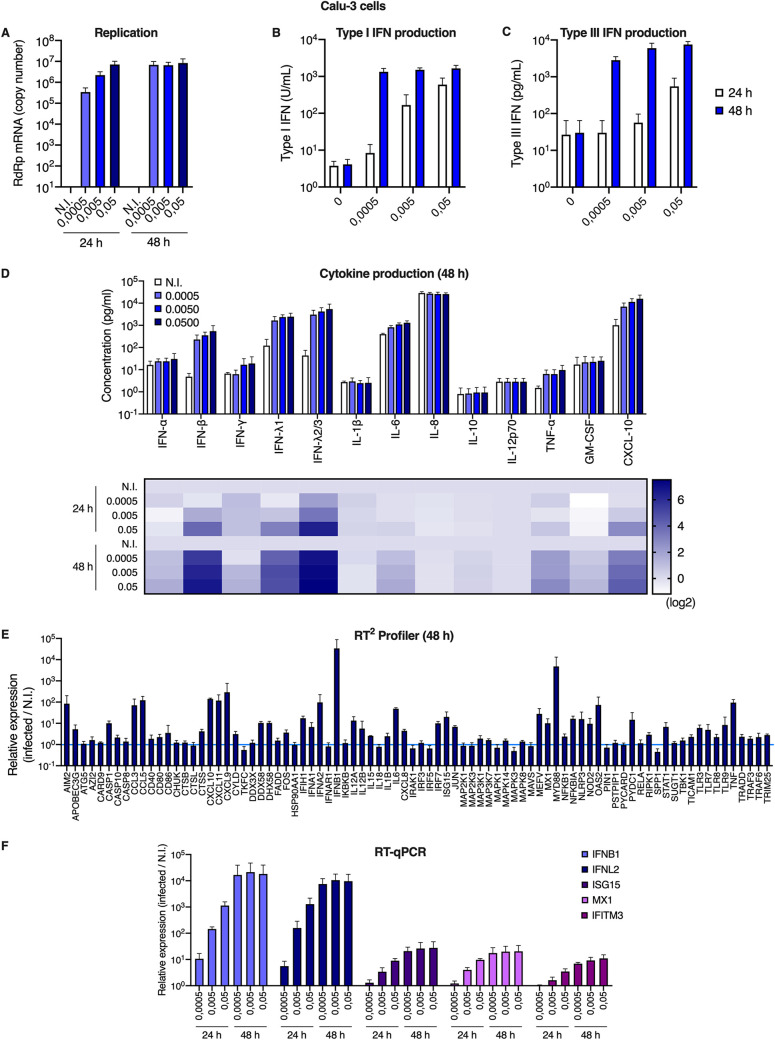
FIG 3.
Calu-3 model cell line responses to SARS-CoV-2 infection. (A) Human Calu-3 cells were N.I. or incubated with SARS-CoV-2 at the indicated MOIs. Cells were harvested and lysed for RNA extraction and RdRp RT-qPCR analysis. (B and C) Cell supernatants from (A) were harvested at the indicated time points and type I (B) or type III (C) IFN concentrations were measured using HEK-Blue IFN-α/β and IFN-λ reporter cells, respectively. (D) Cell supernatants from (A) were harvested and cytokine concentrations were measured using the human antivirus response panel LEGENDplex at 24 h and 48 h. Concentrations are shown (top), and the fold difference in cytokine concentration in supernatants from infected compared to N.I. cells is represented as a heat map (bottom; log2 scale). (E) An antiviral response RT2 profiler PCR array analysis was performed using the RNAs from (A) extracted at 48 h (MOI 0.005). (F) Relative expression levels of the indicated IFN genes and ISGs were analyzed by RT-qPCR analysis at the indicated time points using both ActinB and GAPDH for normalization. The means of four (A and F) or three (B to E) independent experiments are shown, with error bars representing the SD from the mean.

