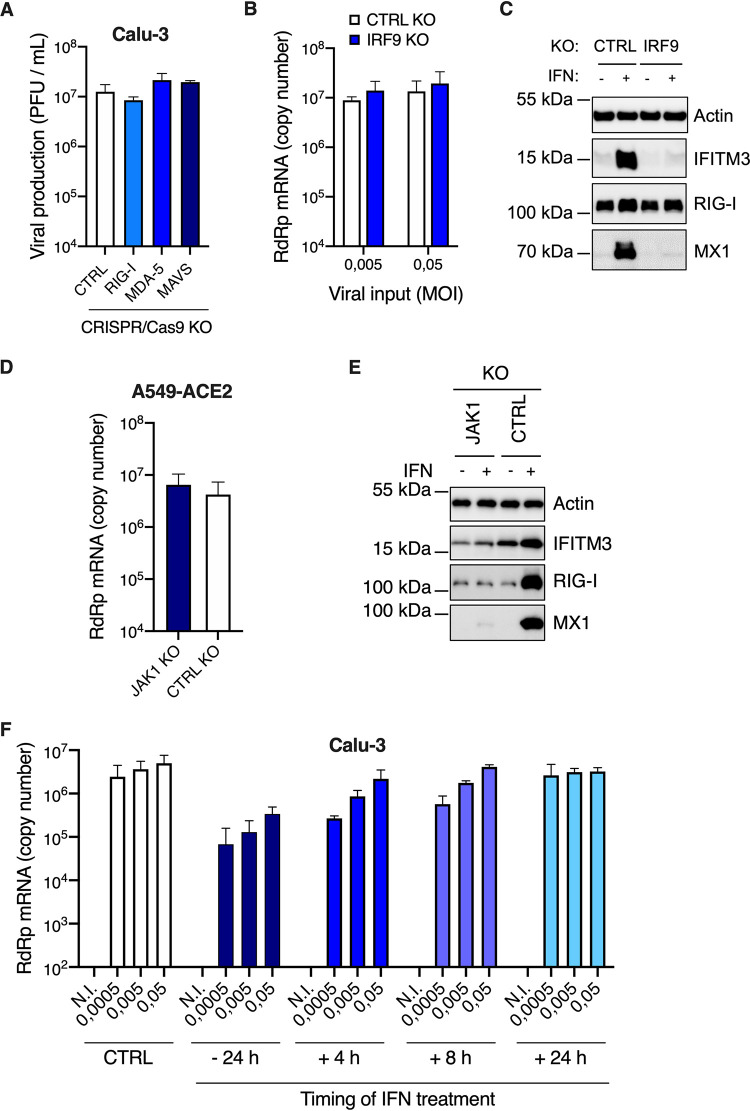
FIG 9.
IFN production upon SARS-CoV-2 replication does not protect Calu-3 and A549-ACE2 cells against infection. (A) CTRL, RIG-I, MDA-5, and MAVS Calu-3 knockout (KO) cells were infected with SARS-CoV-2 at MOI 0.05 (as in Fig. 5B and C) and viral production was measured 48 h later by plaque assays on Vero E6 cells. (B) CTRL and IRF9 Calu-3 KO cells were generated and selected. Cells were infected with SARS-CoV-2 at the indicated MOIs and viral replication was evaluated 48 h later by RdRp RT-qPCR. (C) CTRL and IRF9 KO cells were pretreated or not with IFN for 48 h, lysed, and the expression levels of IFITM3, RIG-I, MX1, and actin were analyzed by immunoblotting. (D) CTRL and JAK1 A549-ACE2 knockout cells were generated and selected. Cells were infected with SARS-CoV-2 at MOI 0.0005 and viral replication was measured 48 h later using RdRp RT-qPCR. (E) CTRL and JAK1 A549-ACE2 knockout cells were pretreated or not with IFN for 48 h, lysed, and the expression levels of IFITM3, RIG-I, and MX1 were analyzed by immunoblotting, with actin serving as a loading control. (F) Calu-3 cells were infected with SARS-CoV-2 at the indicated MOIs after a 24-h pretreatment with IFN or not, or were subsequently treated with IFN at 4 h, 8 h, or 24 h postinfection. Viral replication was measured at 48 h postinfection using RdRp RT-qPCR. The means of two (A and D) or three (B and F) independent experiments are shown, with error bars representing the SD. Representative immunoblots (C and E) are shown.

