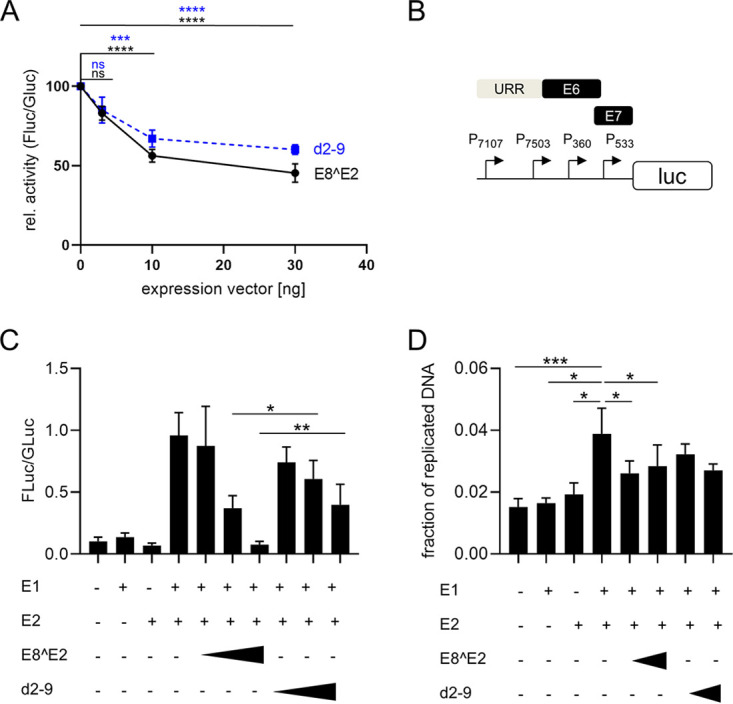
FIG 2.

ME8^E2 inhibits MmuPV1 promoter activity in the absence and presence of mE1 and mE2. (A) C33A cells were transfected with 100 ng of pGL mURR/E1-luc reporter plasmid, 0.5 ng pCMV-Gluc, and 30 ng of empty vector pSG5 or the indicated amounts of pSG mE8^E2 or pSG mE8^E2 d2-9, plus empty vector (pSG5), to obtain equal amounts of plasmid DNA. Luciferase activities were determined 48 h posttransfection. Data are presented as ratios between firefly luciferase (Fluc) and Gaussia luciferase (Gluc) activities relative to those of pSG5-transfected cells. Averages are derived from at least four independent experiments, and the error bars represent the SEM. Statistical significance was determined by one-way ANOVA and Holm-Sidak’s multiple-comparison test (ns, not significant; ***, P < 0.001; ****, P < 0.0001). (B) Schematic structure of the pGL mURR/E1-luc plasmid. Localization of the upstream regulatory region (URR), the E6 and E7 genes, and transcription start sites of the P7107, P7503, P360, and P533 promoters are indicated. (C) C33A cells were transfected as indicated with 50 ng of pGL mURR/E1-luc reporter plasmid; 0.5 ng pCMV-Gluc; 1,000 ng pSG mE1; 100 ng pSG mE2; 10, 30 or 100 ng of pSG mE8^E2 or pSG mE8^E2 d2-9; and empty vector (pSG5) to obtain equal amounts of plasmid DNA. Luciferase activities were determined 48 h posttransfection. Data are presented as ratios between firefly luciferase (Fluc) and Gaussia luciferase (Gluc) activities. Averages are derived from five independent experiments, and the error bars represent the SEM. Statistical significance was determined by a ratio paired t test (*, P < 0.05; **, P < 0.01). (D) C33A cells were transfected as indicated in panel C, and at 48 h posttransfection, total DNA was isolated. Aliquots were digested with DpnI or not, and plasmid copy numbers were then determined by quantitative PCR (qPCR) detecting an amplicon that includes two DpnI restriction sites. Values represent the plasmid fraction resistant to DpnI digestion. Averages are derived from four independent experiments, and the error bars represent the SEM. Statistical significance was determined by a ratio paired t test. (*, P < 0.05; ***, P < 0.001).
