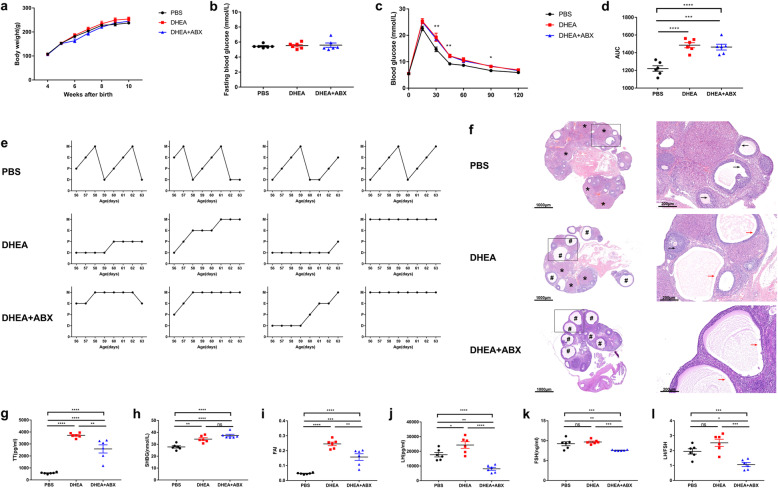
Fig. 1.
DHEA-induced glucose metabolism, ovarian morphology, and reproductive hormone level alterations in conventional and antibiotic-treated rats. a Bodyweight, b FBG, c GTT, d area under the curve of GTT, e oestrous cycle examination and f H&E staining of representative ovaries. * indicates CL, and cyst-like follicles are indicated by #. Black arrows indicate normal granulosa cell layers. Red arrows indicate attenuated granulosa cell layers. Scale bar = 1000 μm (left) and 200 μm (right). g serum TT levels, h serum SHBG levels, i FAI, j serum LH levels, k serum FSH levels and l LH:FSH ratio, DHEA + ABX, DHEA + antibiotics. Data are given as mean ± SEM. n = 6 rats per group. * p < 0.05; ** p < 0.01; *** p < 0.001; **** p < 0.0001

