Fig. 3.
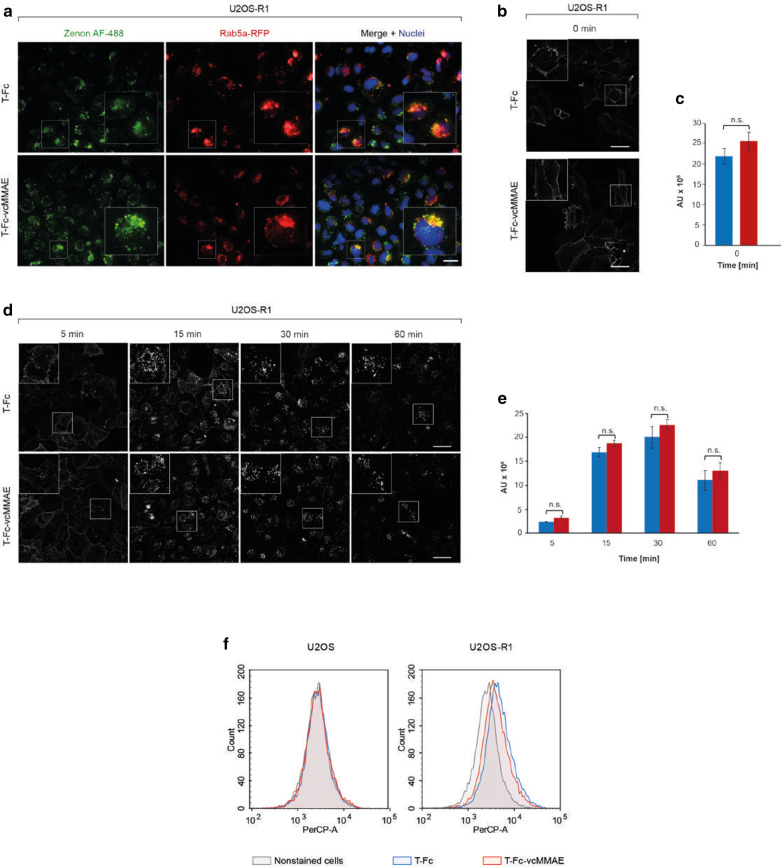
FGFR1-mediated internalization of T-Fc and T-Fc-vcMMAE. a FGFR1-dependent endocytosis of T-Fc and T-Fc-vcMMAE. U2OS-R1 cells stably expressing FGFR1 were incubated with T-Fc or T-Fc-vcMMAE for 15 min at 37 °C. Nuclei were stained with NucBlue Live, and early endosomes were labeled by CellLight Early Endosomes-RFP. Cells were fixed, and internalized antibodies were visualized with Zenon AF-488 using wide-field fluorescence microscope. Scale bar represents 20 μm. b–e Confocal microscopy analysis of the T-Fc and T-Fc-vcMMAE internalization. B and C. U2OS-R1 cells were briefly incubated with T-Fc and T-Fc-vcMMAE (t = 0 min) and analyzed with quantitative immunofluorescence microscopy using Zenon-AF-488 to label Fc-bearing recombinant proteins. d, e T-Fc and T-Fc-vcMMAE were incubated with U2OS-R1 cells for different time periods (5, 15, 30, 60 min) and internalized antibodies were labeled with Zenon AF-488, and analyzed with confocal microscopy. Scale bar represents 50 μm. Quantification of T-Fc and T-Fc-vcMMAE internalization (expressed as integral fluorescence intensity in arbitrary units, AU) was performed using the HARMONY software. Mean values of three independent experiments of integral intensity of Zenon AF-488 signal (c) and integral intensity of Zenon AF-488 vesicles (e) ± SEM are shown. T-test was used to assess the statistical significance of measured differences in internalization; *p < 0.05, **p < 0.01, ***p < 0.0001, n.s.- not significant. f Efficiency and selectivity of T-Fc and T-Fc-vcMMAE internalization studied with flow cytometry. Internalization was analyzed with serum-starved U2OS and U2OS-R1 cells, treated with T-Fc or T-Fc-vcMMAE labeled with DyLight550. After 40 min incubation on ice, cells were transferred to 37 °C for 15 min, and then subsequently analyzed by flow cytometry

