Fig. 4.
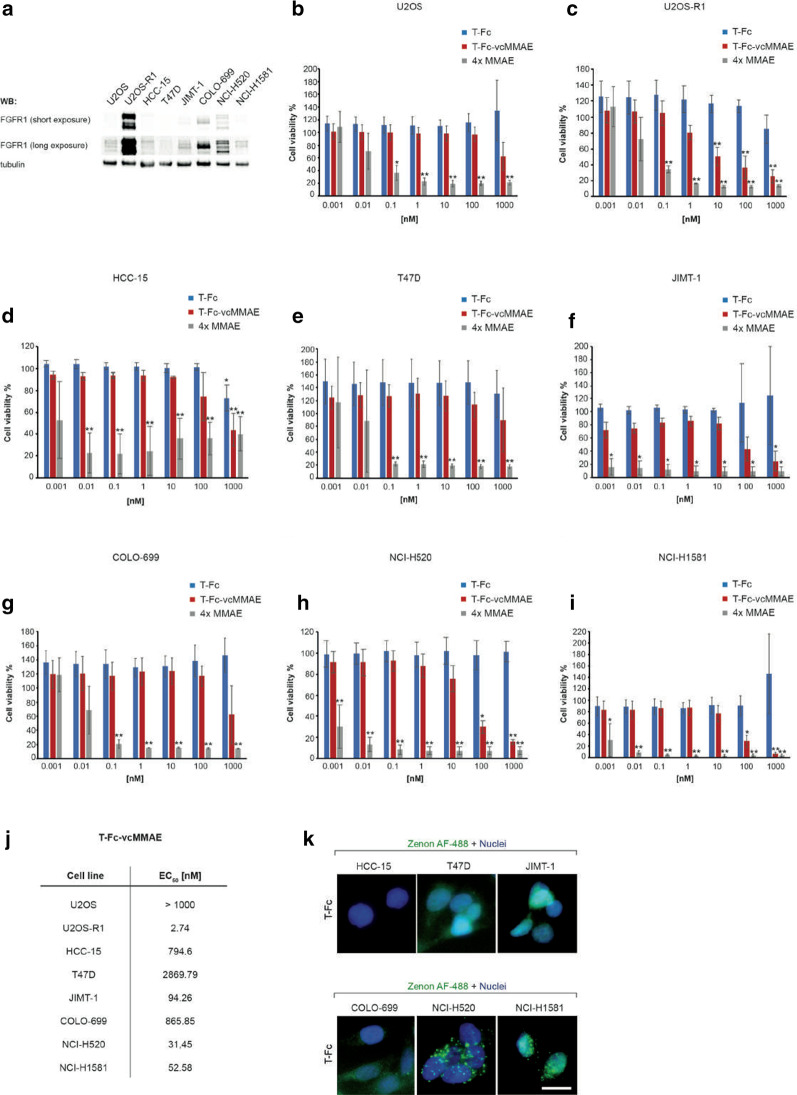
Cytotoxicity of T-Fc-vcMMAE against FGFR1-overproducing cancer cells. a FGFR1 expression levels in studied cell lines analyzed by western blotting using anti-FGFR1 antibody. Tubulin level assessed with anti-tubulin antibody served as a loading control. b–i Cytotoxic potential of T-Fc and T-Fc-vcMMAE. Negative-FGFR1 cells: U2OS (b), HCC15 (d) and T47D (e), and positive-FGFR1 cells: U2OS-R1 (c), JIMT-1 (f), COLO-699 (g), NCI-H520 (h) and NCI-H1581 (i) were treated with indicated agents at various concentrations for 96 h and their viability was assessed with the Presto Blue assay. Presented results are mean values from three experiments ± SD. Statistical significance: *p < 0.05, **p < 0.01, ***p < 0.0001, not significant differences are not marked. j EC50 values for T-Fc-vcMMAE for each cell line, respectively. EC50 values were calculated based on the Hill equation using Origin 7 software (Northampton, MA). k The T-Fc internalization into studied cancer cell lines, visualized with fluorescence microscopy. Cell line tested in cytotoxic assays were incubated with 15 µg/mL of T-Fc for 30 min at 37 °C. Nuclei were stained with NucBlue Live, cells were fixed, and internalized antibodies were visualized with Zenon AF-488 using wide-field fluorescence microscopy. Scale bar represents 20 μm

