Fig. 4.
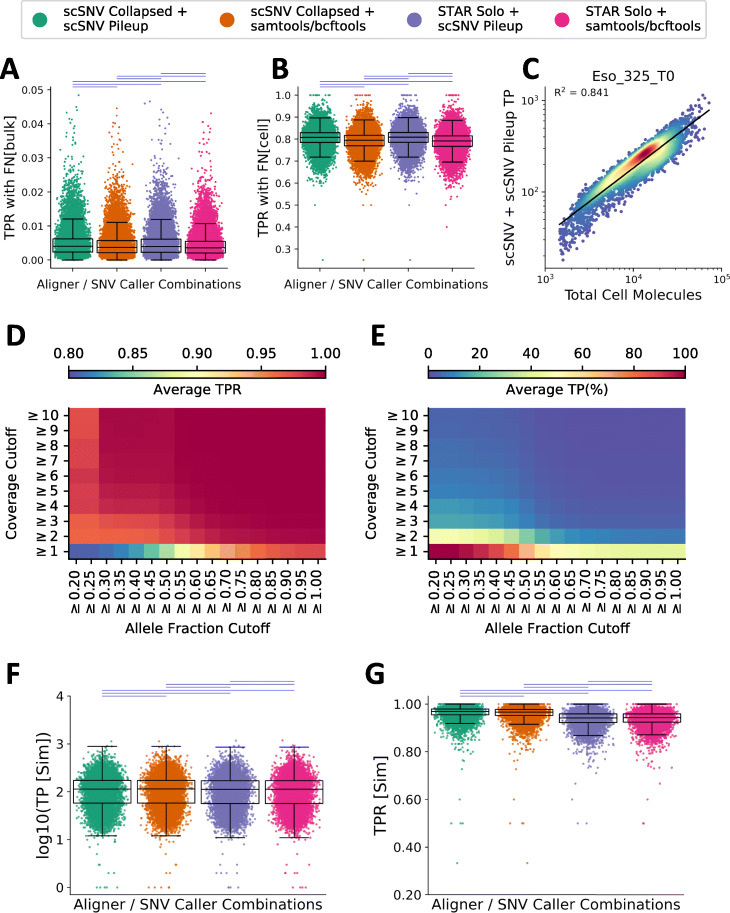
Assessing true-positive detection for single cells using the nine normal tissue samples (N = 36,581 cells) with matched WGS data. a, b The per-cell TPR rate using FN[bulk] (a) and FN[cell] (b) (see the “Results” section for description). Each aligner/SNV caller is indicated as per the legend and the horizontal lines above the plot indicate the results of a two-sided Wilcoxon signed-rank test (P < 0.001 blue otherwise red). c Representative comparison of the number of true-positive SNVs versus the number of spliced + unspliced molecules in the cells from Eso_325_T0, the R2 value and line of best fit as determined by ordinary least squares regression are indicated on the plot (P<0.001). d, e Heatmaps of the average TPR (d) and percent of the true positives detected in each cell (e) across the cells from all nine samples after applying increasing coverage cutoffs (y-axis) and average minor allele fraction cutoffs across the cells from each sample (x-axis) for alignments with scSNV and SNV calls using scSNV Pileup (for other tool combinations, see Additional file 2: Figure S7). f, g The log10 number of true-positive SNVs (f) and the TPR (g) for the aggregated data from all three simulation experiments, where 25,000 homozygous SNVs were simulated; significant comparisons are indicated as in a. The boxplots for a, b, f, and g indicate the 25th, 50th, and 75th percentiles and the whiskers are 1.5 times the interquartile range

