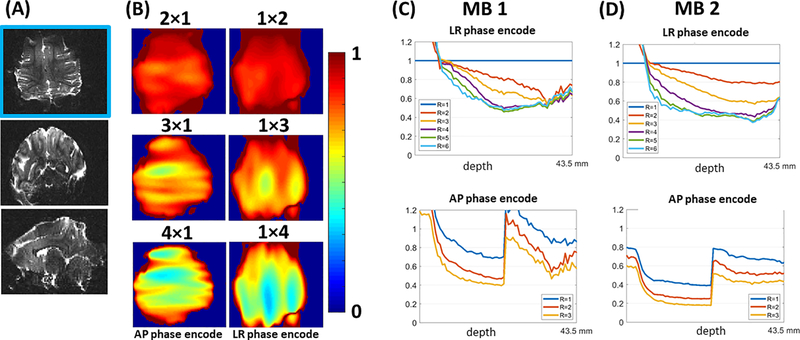
Figure 8:
1/g maps for noise-amplification from parallel imaging calculated using the SE-EPI data. (A) Anatomical images in axial, coronal and sagittal orientations for multi-slice axial SE-EPI used for g-factor calculation from the calculated GRAPPA kernel (B) 1/g maps for R=2,3,4 with phase-encoding undersampling in the L-R and H-F directions calculated using the SE-EPI data corresponding to the axial anatomical images shown in Figure 8A. (C and D) Plots of slice-specific average 1/g value with respect to slice number (stated in terms of depth in millimeters) for R = 1,2,3,4,5,6 (MB 1) and R=1,2,3 (MB 2).

