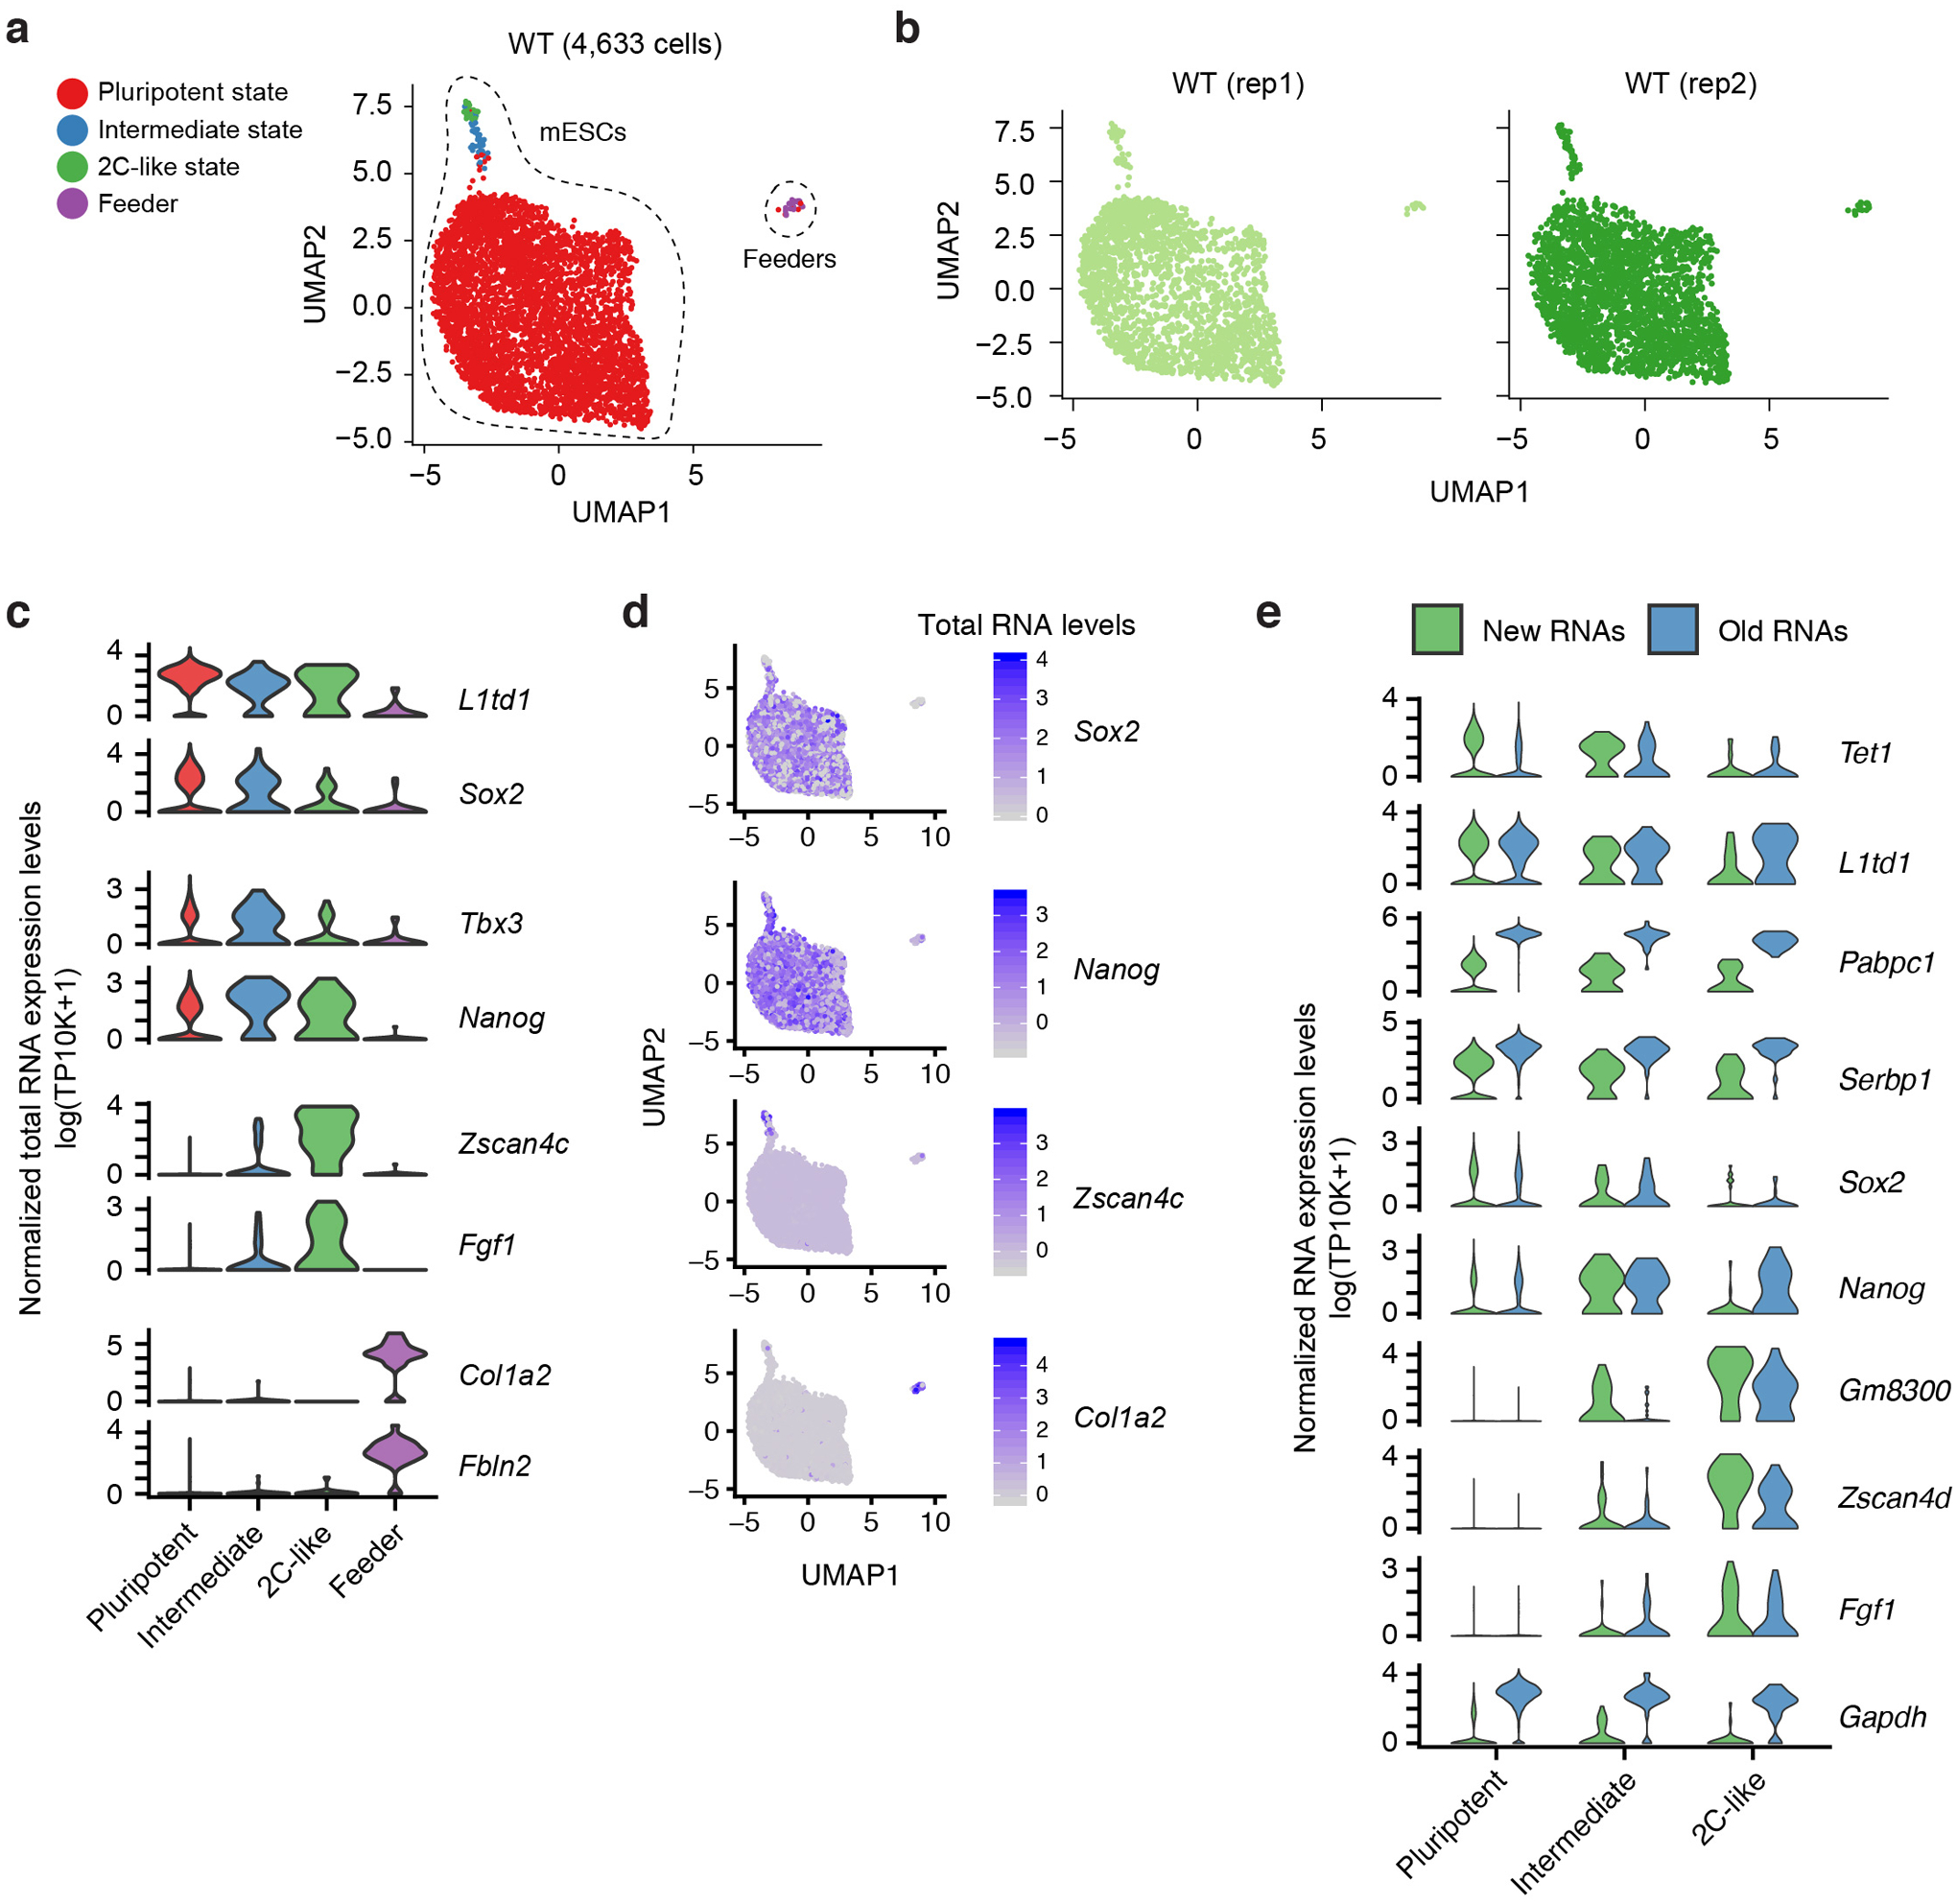
Extended Data Fig. 7. scNT-Seq reveals different stem cell states in mESC cultures.

a. UMAP visualization of 4,633 WT cells (from two biological replicates) colored by different cell-types or cell-states. Feeders are contaminating mouse embryonic fibroblasts.
b. UMAP visualization of two biological replicates in (a).
c. Violin plots showing total RNA levels (natural log transformation of (TP10K + 1)) of representative marker genes for feeders or specific stem cell states.
d. UMAP (same as in (a)) visualization of cells colored by total RNA levels (natural log transformation of (TP10K + 1)) of four representative marker genes.
e. Violin plots showing both new and old RNA levels (natural log transformation of (TP10K + 1)) of selected genes across three stem cell states.
