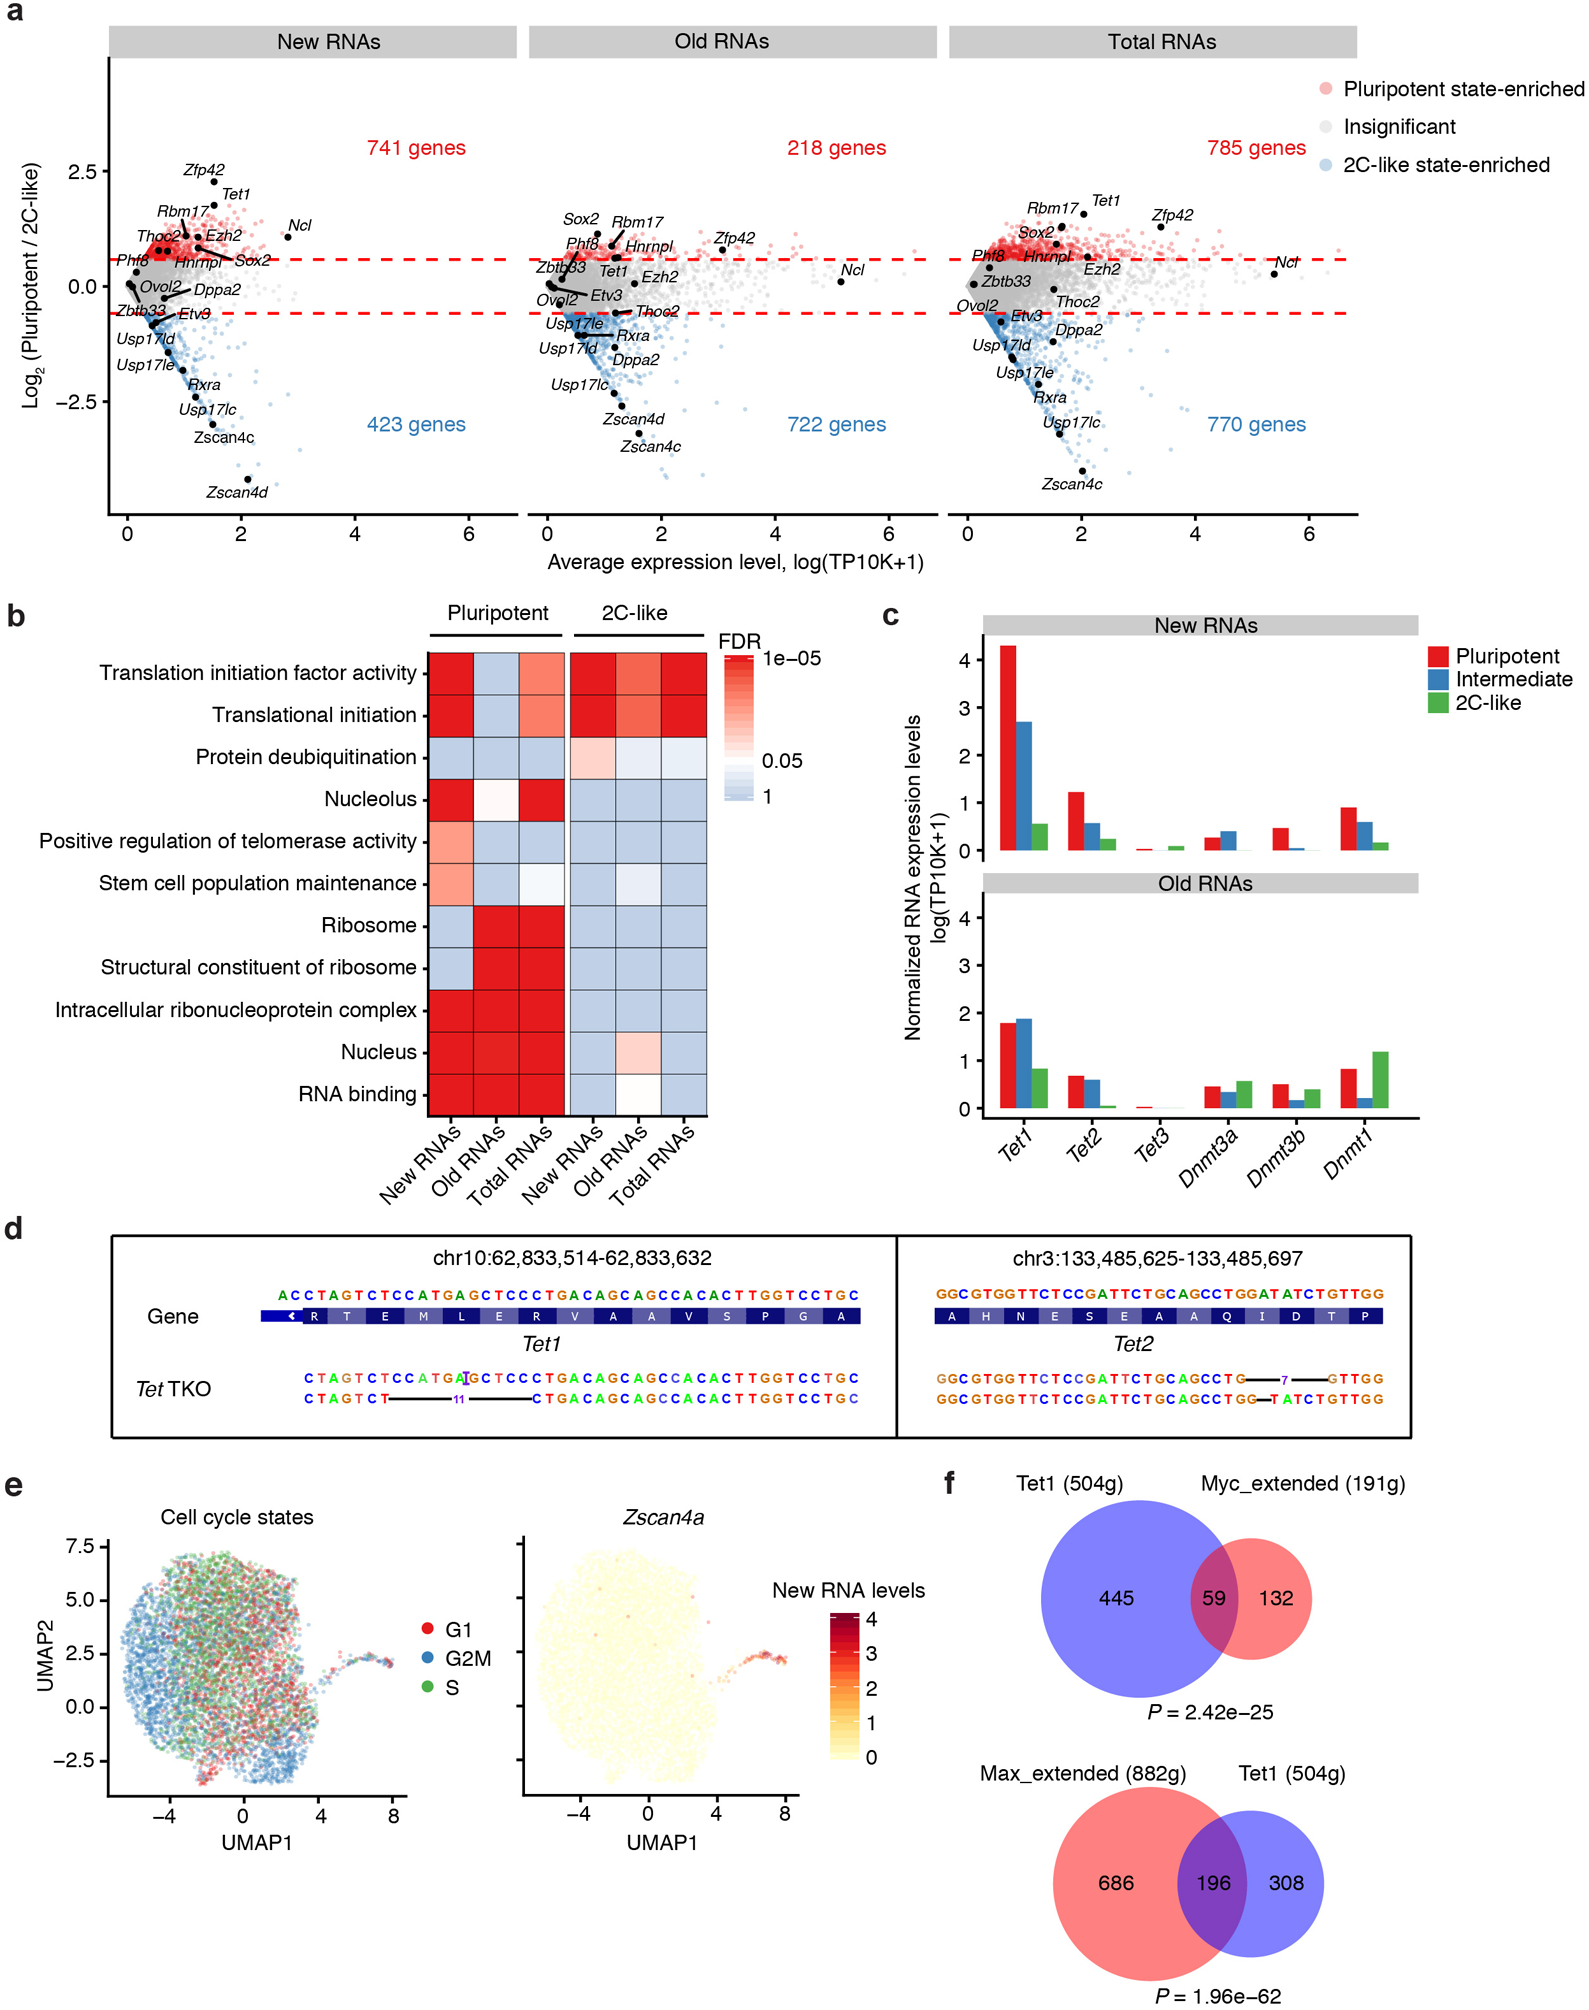
Extended Data Fig. 9. scNT-Seq analysis of the pluripotent-to-2C transition in mESCs.

a. Scatter MA-plot showing differential expression of new, old, and total RNAs between pluripotent and 2C-like states. Dashed line denotes 1.5-fold change between states.
b. Heatmap showing enriched GO terms for state-specific genes. Significance of enrichment (FDR) is scaled by colors. Enrichment analysis was performed using a one-sided hypergeometric test. P-value was then corrected by FDR. The exact P-values of GO terms are in Source Data Extended Data Fig.9.
c. Normalized new and old RNA levels (natural log transformation of (TP10K + 1)) of major DNA methylation regulators across three stem cell states.
d. Validation of genotypes of the Tet1 (-11bp/+1bp) and Tet2 (-7bp/-1bp) genes in Tet-TKO cells by aligning scNT-Seq reads to the CRISPR-Cas9 genome editing sites.
e. UMAP visualization (same as in Fig. 5d) of mESCs colored by cell-cycle states (left) or the new RNA level (natural log transformation of (TP10K + 1)) of Zscan4a (right).
f. Venn diagrams showing significant overlap between Tet1 and Myc regulon target genes (upper) (P-value = 2.42 × 10⁻²⁵, two-sided Fisher’s exact test), and between Tet1 and Max regulon target genes (lower) (P-value = 1.96 × 10−62, two-sided Fisher’s exact test).
