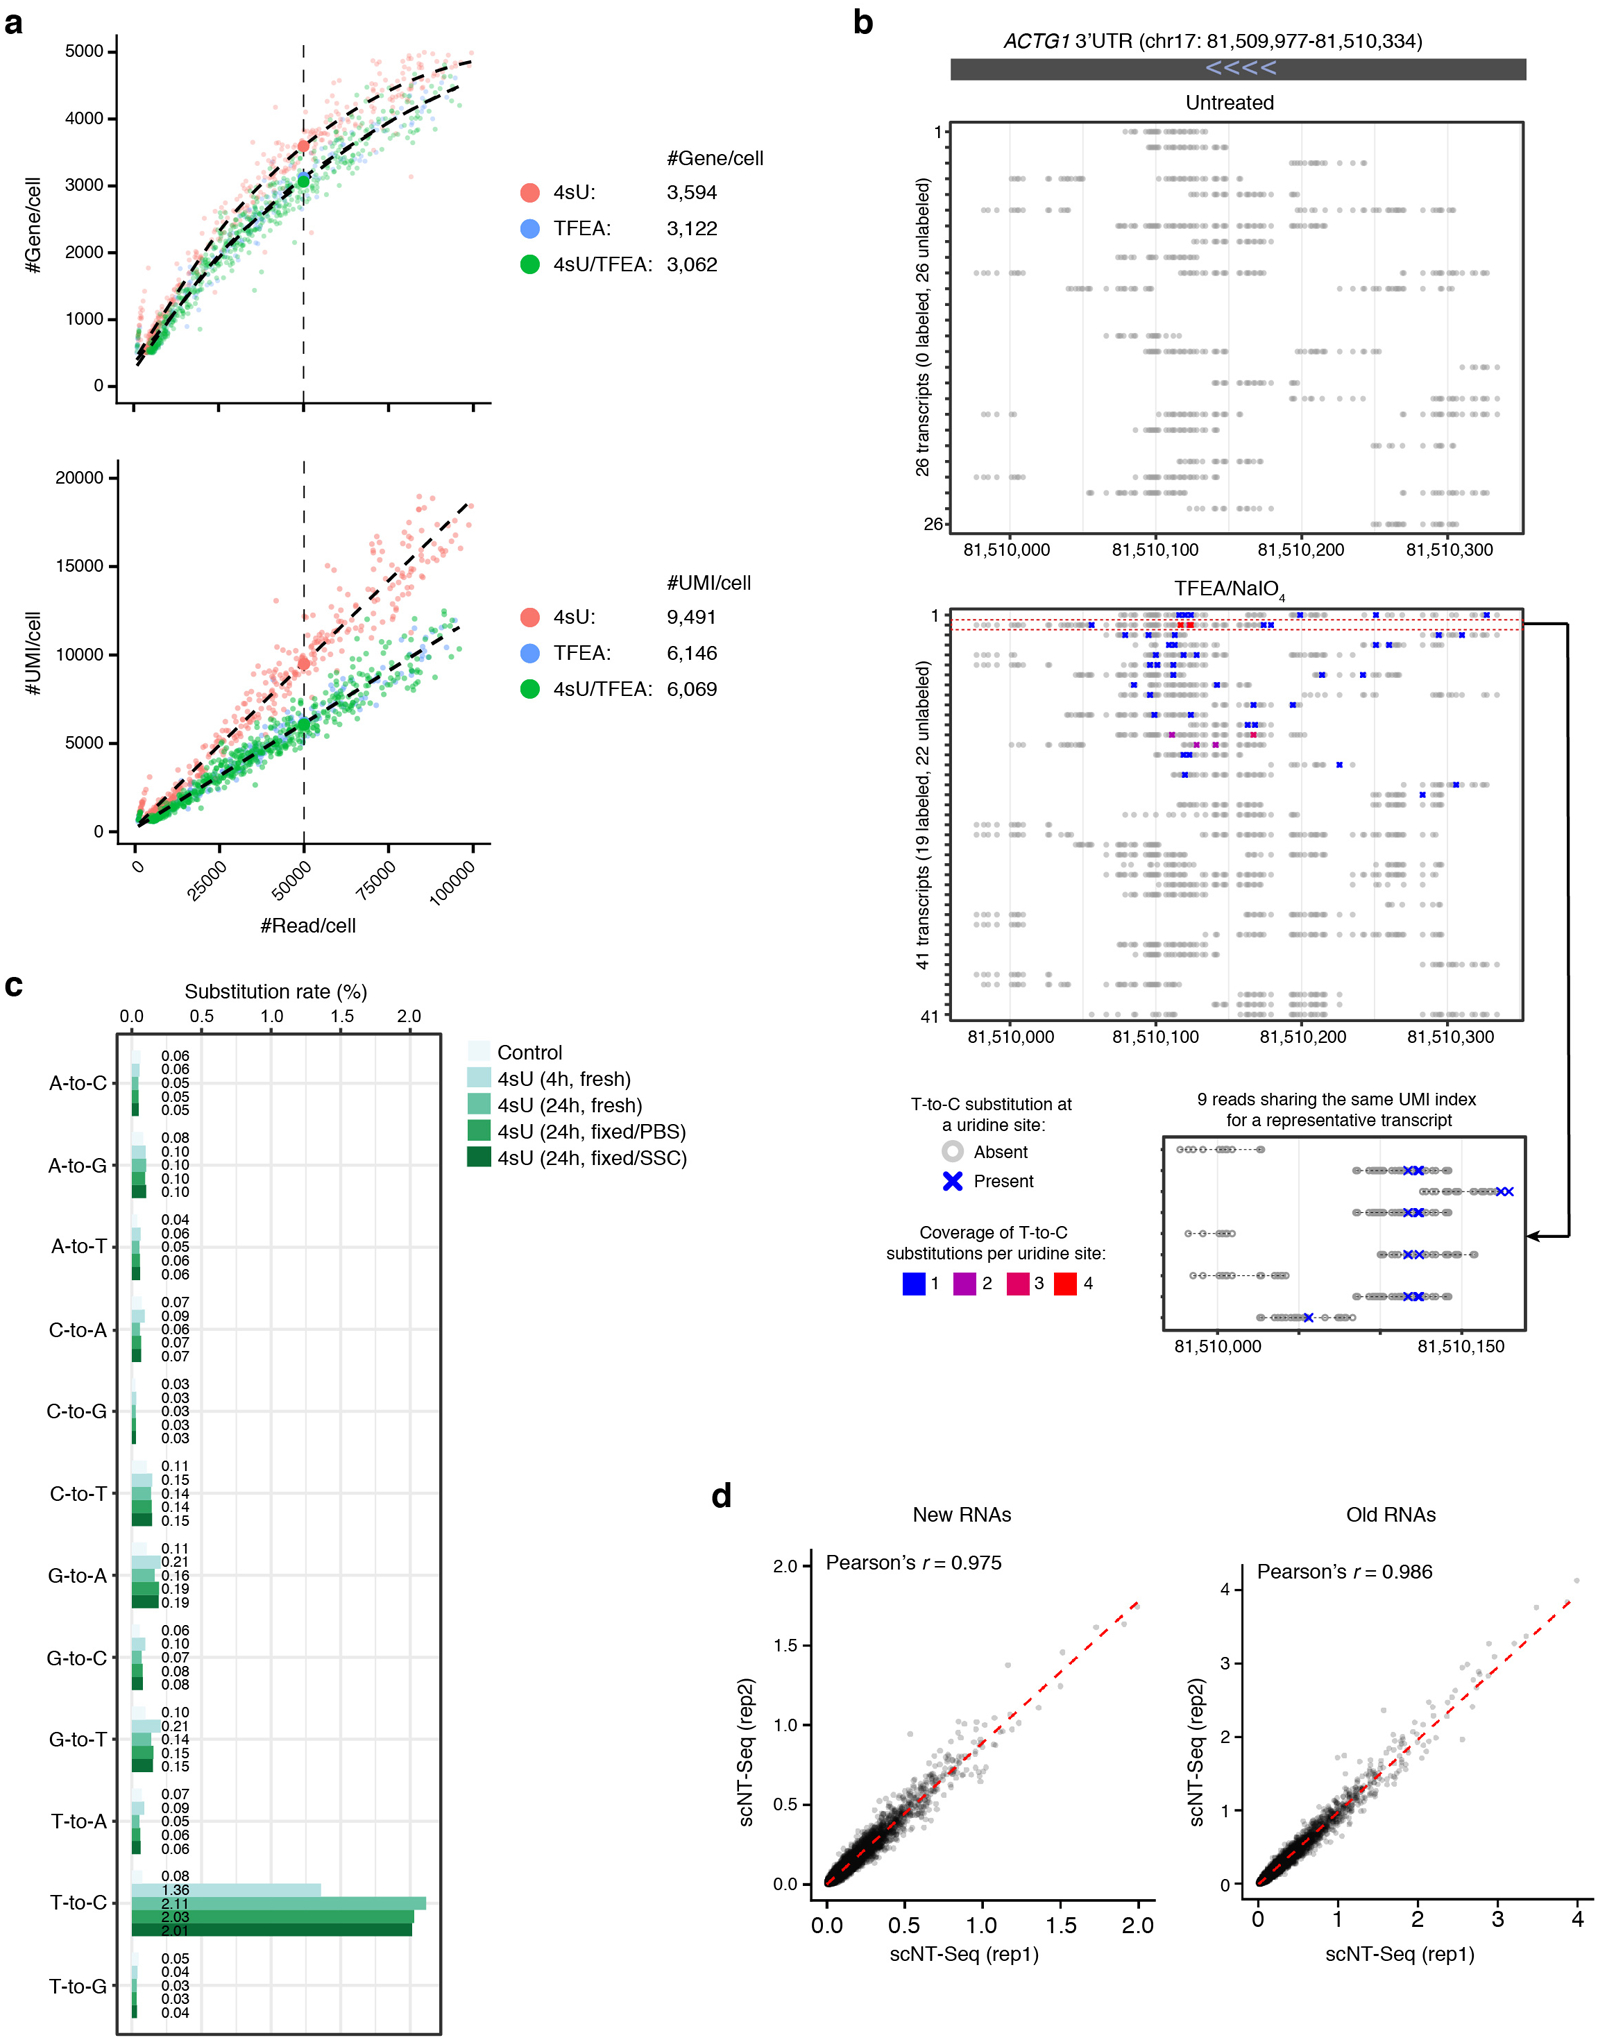
Extended Data Fig. 10. Benchmarking the 2nd SS scNT-Seq protocol in human K562 cells.

a. Bar plot showing nucleotide substitution rates in K562 cells analyzed with different experimental protocols. 4sU, metabolic labeling with 4sU (100 μM, 4 h); TFEA, on-bead TFEA/NaIO4 chemical reaction; 2nd SS, second strand synthesis.
b. PCA plots showing K562 cells colored by the total RNA level of the TOP2A gene (natural log transformation of (TP10K + 1)) in three experimental protocols (same as in Fig. 6d).
c. Violin plots showing the new-to-total RNA ratios of 8 representative cell-cycle genes in datasets generated by 2nd SS (4sU/TFEA/2nd SS, n =795 cells) or standard (4sU/TFEA, n = 533 cell) scNT-Seq protocols. See ‘Data visualization’ in the Methods for definitions of box-plot elements.
d. Same as in c but showing new and old RNA levels (natural log transformation of (TP10K + 1)).
