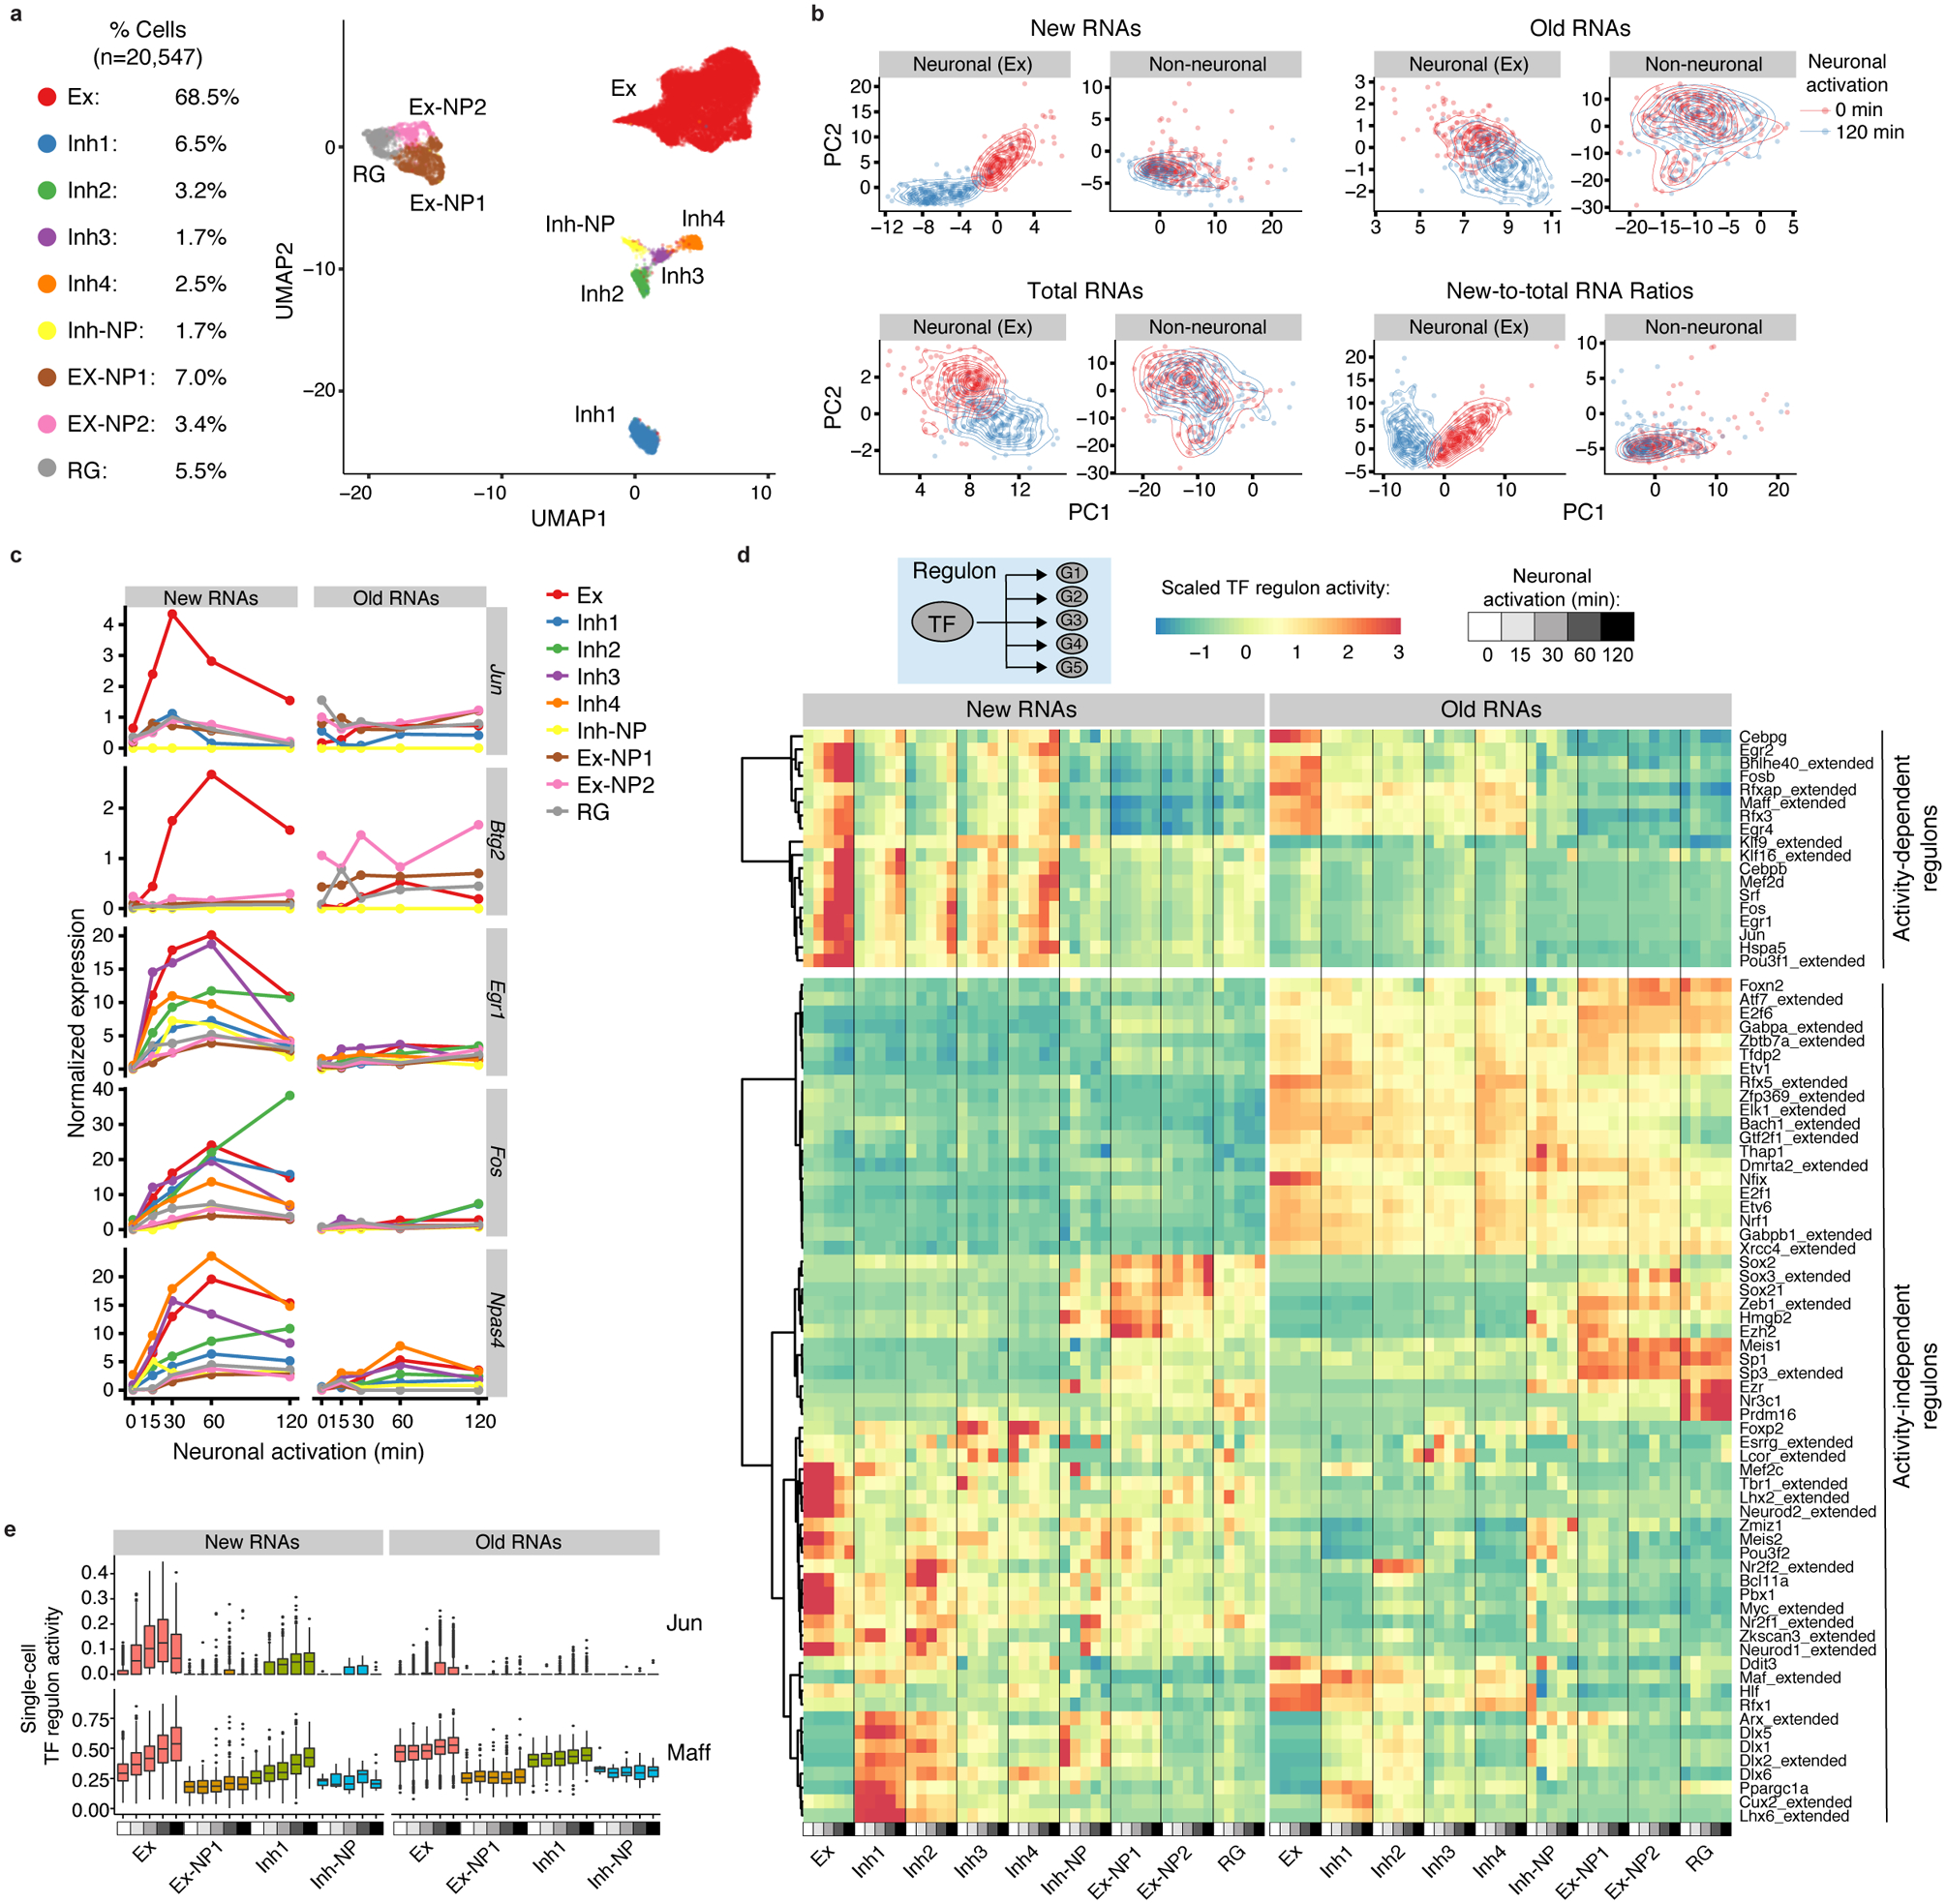
Fig. 2. scNT-Seq captures newly synthesized transcriptomes and time-resolved regulon activity in response to neuronal activation.

a. UMAP visualization of 20,547 mouse cortical cells colored by their cell-types. Fractions of each cell-type are shown on the left. Ex, excitatory neurons; Inh, inhibitory neurons; NP, neural progenitors; RG, radial glial cells.
b. PCA plots showing excitatory neurons and non-neuronal cells at resting (0 min: red) or stimulated (120 min: blue) states based on their newly-synthesized transcriptomes (new RNAs), pre-existing transcriptomes (old RNAs), whole transcriptomes (total RNAs), and new-to-total RNA ratios. 200 cells (with >1,000 genes detected per cell) were randomly chosen from excitatory neurons or non-neuronal cells (Ex-NP1, Ex-NP2 and RG) at the two time points. Density of dots was indicated by contour lines.
c. Line plot showing cell-type specific new and old RNA expression for select activity-induced genes in response to distinct activation durations. The mean new and old RNA levels were scaled by library size (TP10K, Transcripts Per 10,000 transcript/UMI counts).
d. Clustered heatmap showing cell-type-specific regulon activity of 79 TFs in response to distinct activity durations, concurrently inferred from either new or old RNAs. 18 activity-dependent regulons were associated with significantly increased new RNA levels of their target genes in at least one cell-type (adjusted P <0.05 and fold change >1.5) after KCl stimulation. Two-sided Wilcoxon rank sum test was used to assess significance of the difference. P-values were adjusted by Bonferroni correction. The P-value and regulon activity of each TF are in Source Data Fig.2 and Supplementary Table 3, respectively.
e. Boxplots showing cell-type-specific regulon activity (inferred from either new or old RNAs) of Jun and Maff in response to distinct activity durations. Cell number, Ex: n = 1,422 (0 min), 2,678 (15 min), 2,884 for (30 min), 4,664 (60 min) and 1,863 (120 min); Ex-NP: n = 147 (0 min), 169 (15 min), 218 (30 min), 391 (60 min) and 177 (120 min); Inh1: n = 146 (0 min), 244 (15 min), 311 (30 min), 428 (60 min) and 166 (120 min); Inh-NP: n = 7 (0 min), 3 for (15 min), 12 for (30 min), 20 (60 min) and 19 (120 min). See ‘Data visualization’ in the Methods for definitions of box-plot elements.
