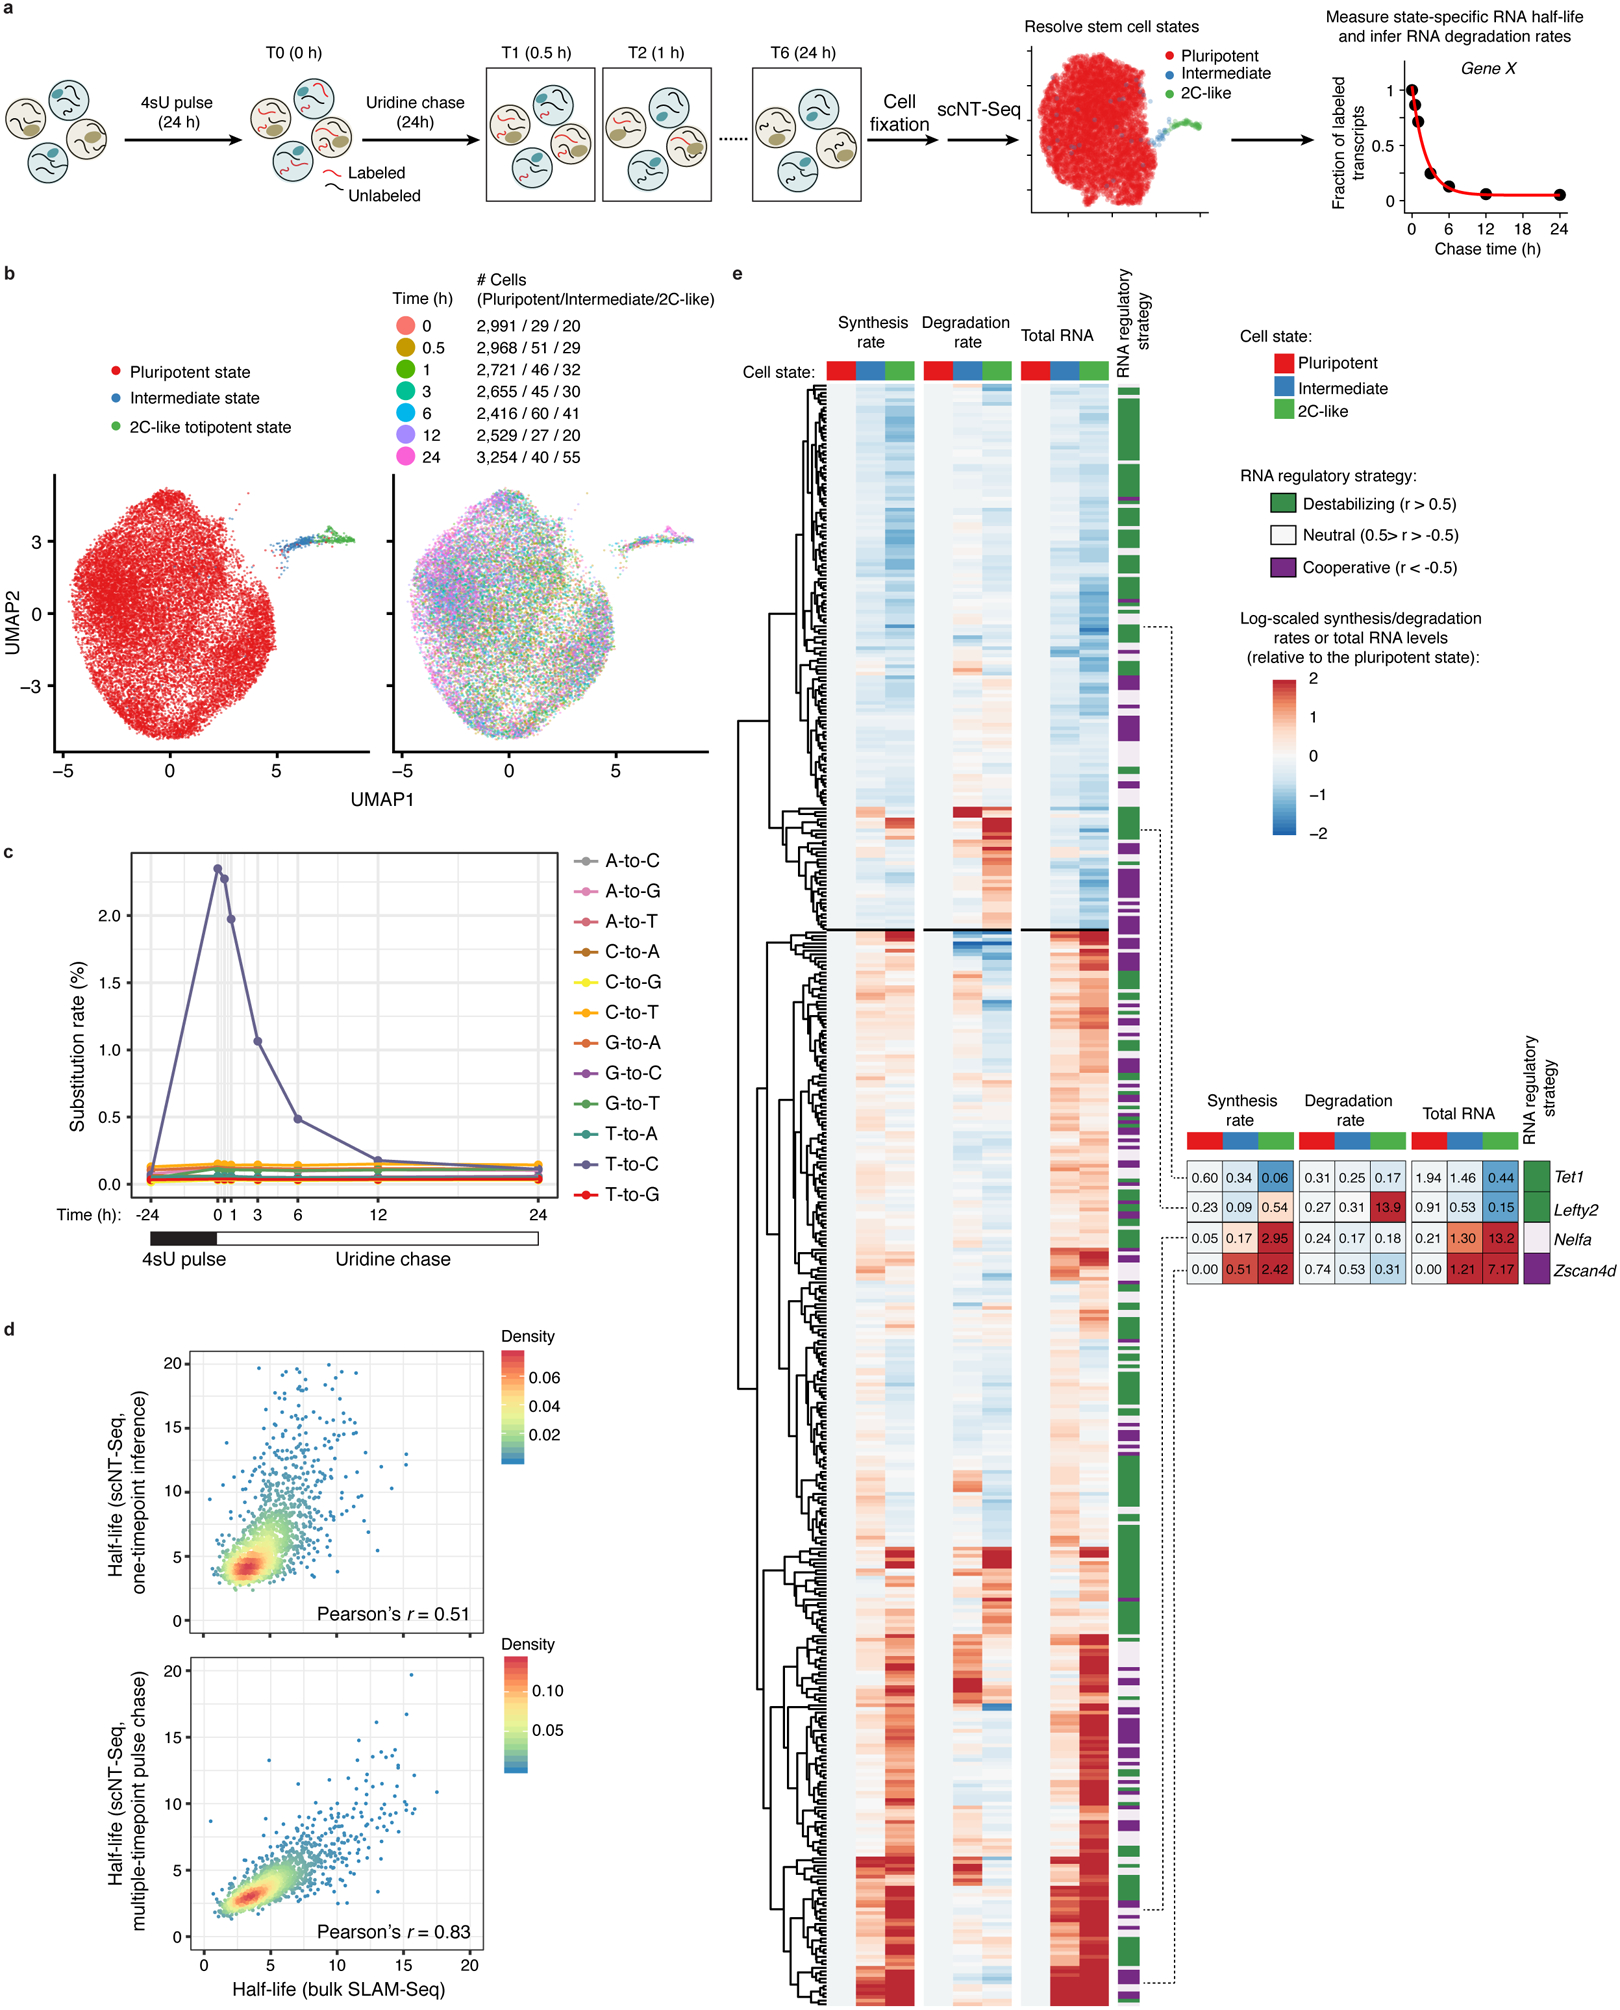
Fig. 4. scNT-Seq reveals mRNA regulatory strategies during stem cell state transition.

a. Design of pulse-chase scNT-Seq experiments.
b. UMAP visualization of 20,059 mESCs colored by three stem cell states (left) or by 7 time points during chase (right). Cell numbers of each state across 7 time points are also shown.
c. Line plots showing changes in nucleotide substitution rates across 7 time points of pulse-chase.
d. Scatter plots showing Pearson’s correlation of RNA half-life measurements (n=1,926 genes) between this study (top: one timepoint inference (4sU, 4 hours); bottom: multiple timepoint pulse chase) and bulk SLAM-Seq in mESCs.
e. Clustered heatmaps of estimated synthesis rates (left), degradation rates (middle), and observed total RNA levels (right) of 445 genes across three stem cell states. The values in intermediate or 2C-like states were normalized to the pluripotent state. Also shown are RNA regulatory strategies (cooperative, 110 genes; neutral, 136 genes; destabilizing, 199 genes) colored-coded by similarity between the synthesis and degradation rates. Rightmost panel shows four representative genes with their raw synthesis/degradation rates and total RNA levels indicated. The synthesis rate, degradation rate, total RNA abundance, and regulatory strategy of each gene are in Supplementary Table 5.
