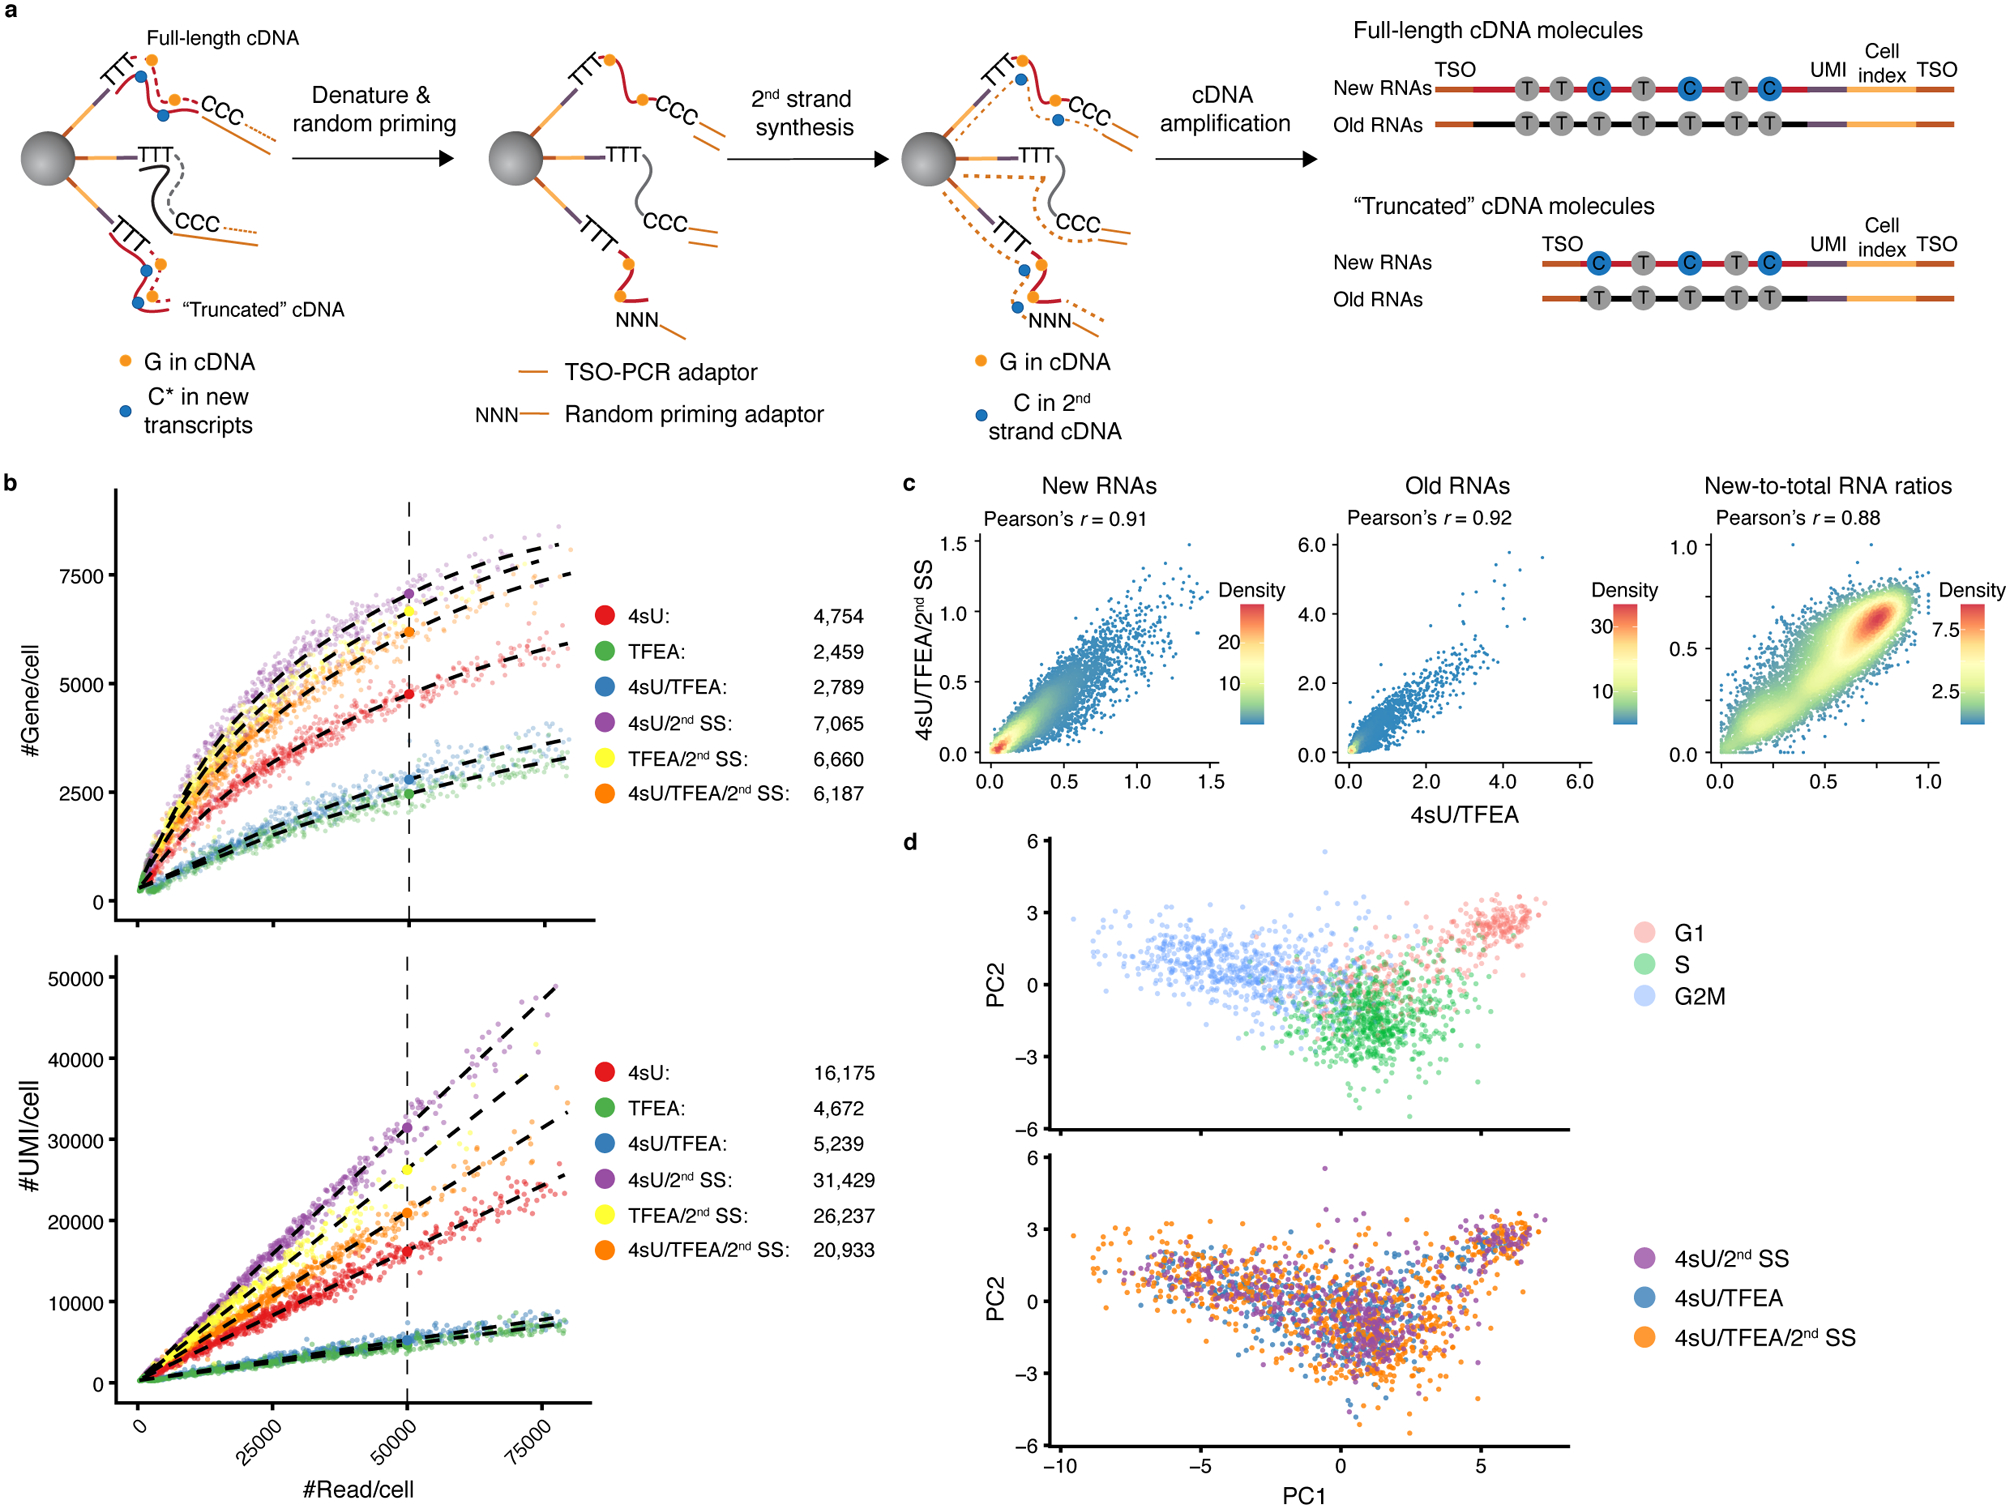
Fig. 6. Second strand synthesis reaction enhances the efficiency of scNT-Seq.

a. The second strand synthesis (2nd SS) reaction workflow in scNT-Seq.
b. Scatterplots comparing the number of gene (y-axis, upper panel) or UMI (y-axis, lower panel) detected per cell as a function of aligned reads per cell (x-axis) between 4sU (n=692 cells), TFEA (n=447 cells), 4sU/TFEA (n=533 cells), 4sU/2nd SS (n=515 cells), TFEA/2nd SS (n=400 cells), and 4sU/TFEA/2nd SS (n=795 cells) experiments. 4sU, metabolic labeling with 4sU (100 μM, 4 h); TFEA, on-bead TFEA/NaIO4 chemical reaction; 2nd SS, second strand synthesis reaction. The fitted lines for each experiment were shown. Right panels show estimated numbers of gene or UMI detected per cell at matching sequencing depth (50,000 reads per cell) for different experiments.
c. Scatterplots showing Pearson’s correlation for new (left), old (middle) RNA abundance and new-to-total RNA ratio (right) between standard (4sU/TFEA) and 2nd SS (4SU/TFEA/2nd SS) scNT-Seq protocols. Levels of new and old RNAs are in natural log transformation of (TP10K + 1).
d. PCA plots showing K562 cells colored by cell-cycle states (top) or experiments (bottom).
