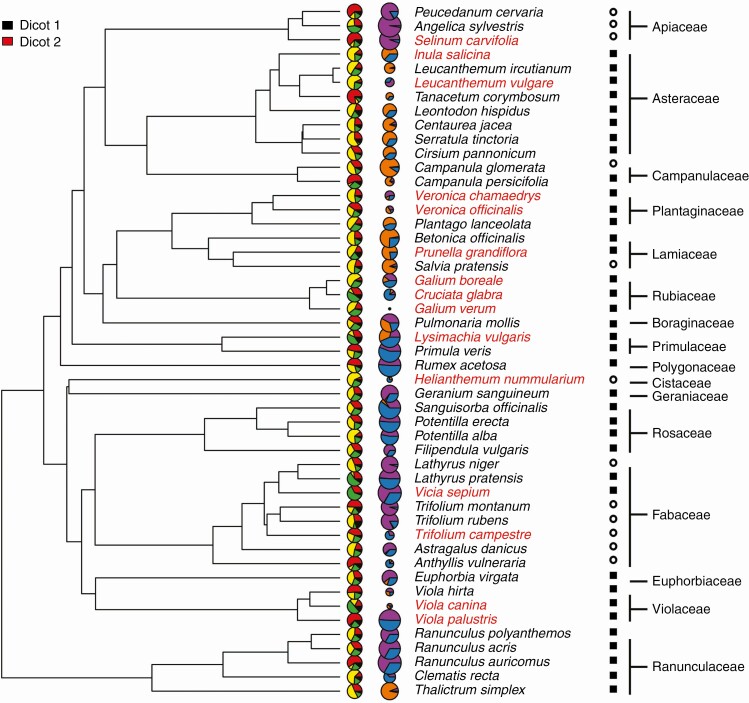
Fig. 4.
Phylogenetic tree of studied dicots with visualization of anatomy and storage proportions, anatomical type and family. The size of pie charts for carbohydrates corresponds to the logarithm of total storage (for key see Fig. 3) and species name colour denotes anatomical category. Storage organ type is denoted by a black square for rhizomes and a white circle for roots.

