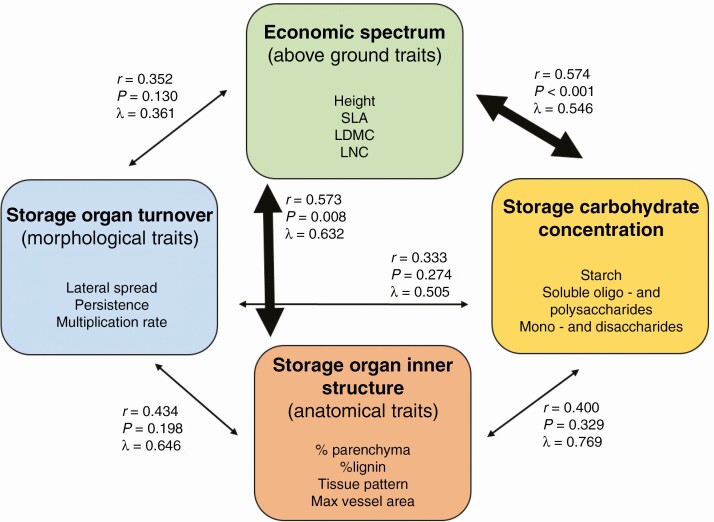
Fig. 5.
Relationships between groups of traits. For each pair the figure shows the correlation among first canonical axes (r), the P-value of the first and all other correlations being zero, and λ (phylogenetic signal). All groups contained 78 species except for storage organ turnover, with only 76 species. Wide arrows denote significant relationships. Details of multivariate comparisons are depicted in Fig. 6.

