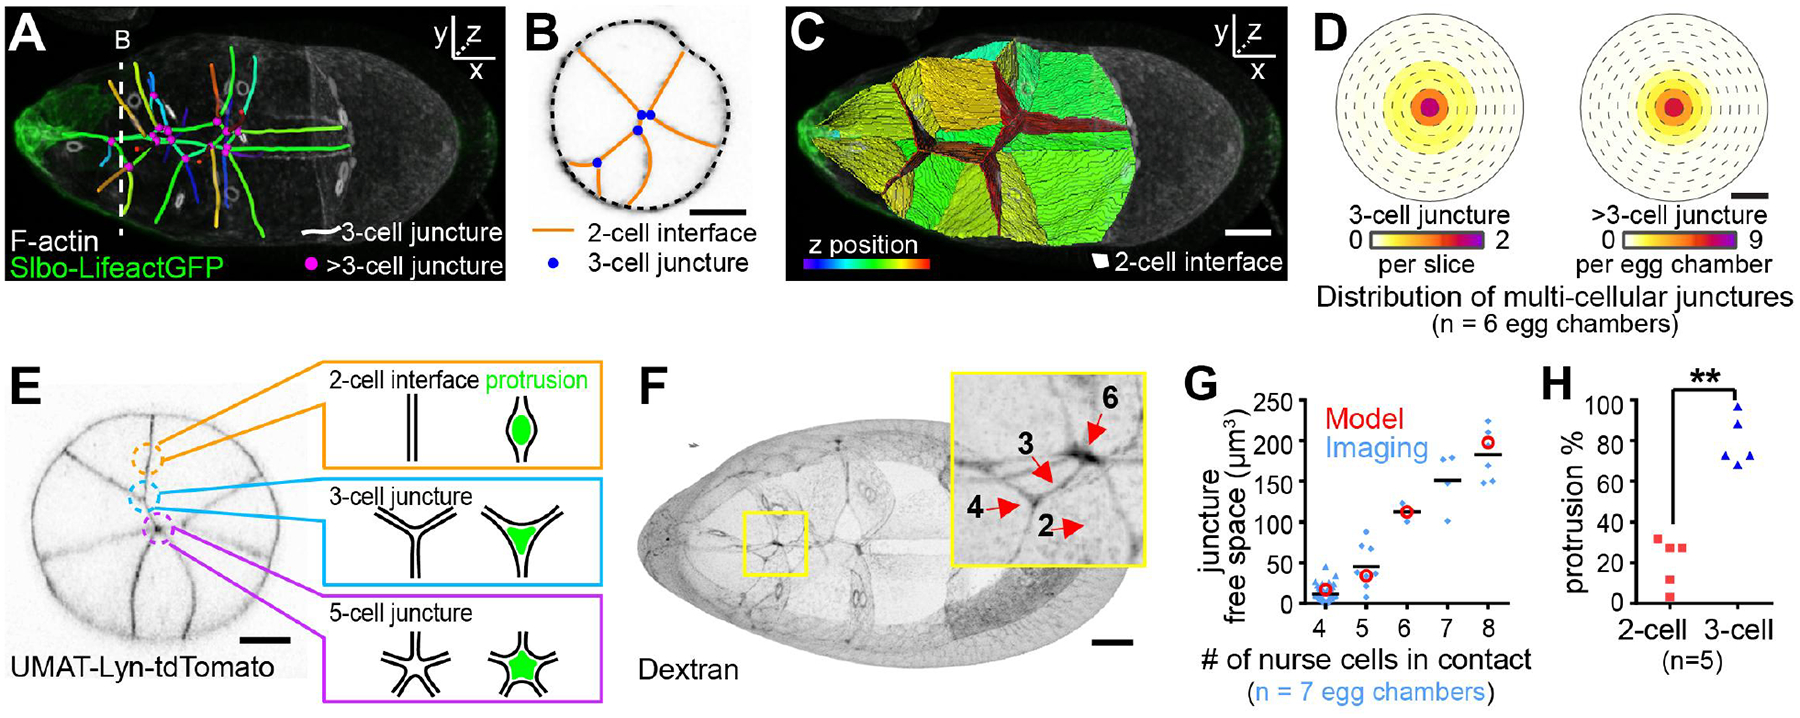
Fig. 3. Centrally enriched multiple-nurse-cell junctures.

(A to C) 3D reconstructions of nurse-cell contacts. Dashed lines in (A) indicate cross sections in (B). (D) Heat map showing distributions of three- (left) or more-than-three- (right) cell junctures as a function of mediolateral position. (E) Schematic representation of protrusion into nurse-cell junctures. (F) Extracellular spaces filled with fluorescent dextran in wild-type. (G) Quantification of the extracellular juncture volume. Values from the 3D model (red) (see the supplementary text, section ST1) and the experimental data (blue). (H) Percentage side protrusions extending to two-cell or three-cell junctures as a fraction of total side protrusions. **, P <0.01 (paired t test). Scale bars, 20 μm.
