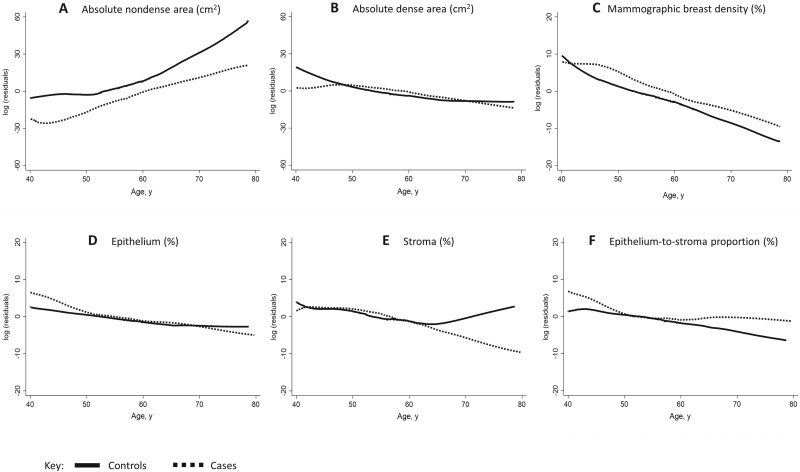
Figure 2.
Histologic and radiologic breast tissue composition metrics by age and case-control status. Locally weighted scatter plot smoothing of log residuals (y-axes) from linear regression models of nondense area (A), dense area (B), percent mammographic breast density (C), epithelium (D), stroma (E), and epithelium-to-stroma proportion (F). The effects of body mass index and benign breast disease histology on breast tissue composition were accounted for by adjusting for these in the linear regression models and plotting the log residuals against age.

