

Abstract
Despite the elimination of measles in the United States (US) in the year 2000, cases continue to occur, with measles outbreaks having occurred in various jurisdictions in the US in 2018 and 2019. Understanding the cost associated with measles outbreaks can inform cost-of-illness and cost-effectiveness studies of measles and measles prevention. We performed a literature review and identified 10 published studies from 2001 through 2018 that presented cost estimates from 11 measles outbreaks. The median total cost per measles outbreak was $152 308 (range, $9862–$1 063 936); the median cost per case was $32 805 (range, $7396–$76 154) and the median cost per contact was $223 (range, $81–$746). There were limited data on direct and indirect costs associated with measles. These findings highlight how costly measles outbreaks can be, the value of this information for public health department budgeting, and the importance of more broadly documenting the cost of measles outbreaks.
Keywords: measles outbreak, review, cost, economic
Measles is a highly infectious vaccine-preventable disease that is transmitted person-to-person and causes an acute febrile rash illness. Measles can lead to serious complications, including pneumonia, encephalitis, and death [1, 2]. Due to attainment of high measles vaccination coverage, measles was declared eliminated (defined as the interruption of continuous transmission lasting ≥ 12 months) from the United States (US) in the year 2000 [3]. Despite the occurrence of several large measles outbreaks in various jurisdictions in the US, including as recently as 2018 and 2019 (eg, in Washington, New York, and Michigan), elimination has since been sustained in the country [4–6]. The origin of these cases and outbreaks was international, primarily US travelers returning from countries where measles is still endemic [7], followed by contact with susceptible (unvaccinated) populations and subsequent transmission [8].
Efforts needed to respond to a measles outbreak can strain public health resources. Based on personnel hours and resources utilized, Ortega-Sanchez et al (2012) estimated the economic burden on US public health institutions to respond to 16 measles outbreaks in 2011 to be between US$2.7 million and US$5.3 million [9]. Lo and Hotez (2017) modeled the potential consequences of a 5% decline in measles-mumps-rubella (MMR) vaccine coverage among children aged 2–11 years in the US, which could result in 150 additional measles cases and $2.1 million in public sector costs [10]. Both of these analyses are limited to public health responses and do not include direct medical and nonmedical costs incurred by patients, families, providers, and healthcare systems, or productivity losses. As such, these estimates are likely conservative relative to the total economic burden that these outbreaks impose on society.
In this article, we review published studies that have presented cost estimates of measles outbreaks (here defined as 1 or more measles cases) and analyze the available data from various perspectives and by cost types. We briefly discuss the key components and considerations that might be helpful in future cost evaluations of measles outbreaks.
METHODS
We identified scholarly articles reporting cost of measles outbreaks in the US by searching PubMed and Google Scholar using the term “measles” with “cost” or “economic” or “burden” or “outbreak” in the title of publications from January 2001 (the year after measles elimination was declared in the US) through December 2018. We conducted a structured review of the studies relying on titles, abstracts, and full text. Studies were excluded if the titles or abstracts indicated it was either non–US based or not an evaluation of a measles investigation (ie, literature reviews or opinion pieces). Abstracts or full texts were reviewed to determine if costs were collected in the study. Only studies of measles outbreaks occurring after 2000 and that collected costs were included in this analysis.
We conducted a full-text review of each study in the final analytical set and extracted the following information if reported: year of case(s), number of cases, number of contacts (exposed persons), chain duration (defined as the difference in days between rash onset in the first and last case), investigation period, number of cases hospitalized, total costs, costs by type, and perspective. There are various types of costs (eg, costs related to medical treatment or response) that can be collected in an evaluation of the cost of a measles outbreak, as well as different perspectives that can be taken. A perspective can be considered the viewpoint from which the study is conducted, such as healthcare sector, public health, or healthcare provider (Table 1). Further details on the types of costs and perspectives can be found in the Supplementary Materials. Additional variables collected are reported in Supplementary Table 1. Cost types reported for each investigation are in Supplementary Table 2.
Table 1.
Labor and Material Costs to Collect in Evaluations of the Economic Burden of Measles
| Evaluation Type | Details |
|---|---|
| By cost | |
| Direct |
|
| Indirect or productivity losses |
|
| Response |
|
| By perspective | |
| Healthcare |
|
| Patient |
|
| Provider |
|
| Employer |
|
| Public health |
|
| Societal |
|
For each investigation, we calculated per case, per contact, per chain duration, and per investigation period. We summarized these results, along with total cost, by providing the median and ranges of each cost. The costs were stratified based on the types of costs collected and the perspective used in each study. If a perspective was not explicitly stated, we imputed the perspective based on the types of costs reported. For example, the perspective of Coleman et al (2012) was not reported [11]. However, costs were detailed and we were able to separate costs from the public health perspective and costs from the provider perspective (Supplementary Table 3). For direct medical costs, the cost per hospitalized case was calculated after removing outpatient costs. All costs are presented in 2018 dollars with inflation adjustments made using the medical care component of the Consumer Price Index [12].
RESULTS
Our initial search resulted in 563 studies from PubMed and 253 studies from Google Scholar. After applying our exclusion criteria, we identified 10 studies reporting costs associated with a measles outbreak, which we defined as ≥ 1 case of measles for this review. One study reported costs for 2 separate measles outbreaks [13], so the final results in this review represent economic evaluations conducted for a total of 11 outbreaks. Six evaluations were conducted from the public health perspective only, 3 from the provider perspective only, and 2 from both the public health and provider perspectives (Table 2). No evaluations reported costs from the healthcare, patient, employer, or societal perspectives. Eight evaluations reported response costs only, 2 reported both response and direct costs, and 1 evaluation reported response, direct, and indirect costs. Response costs included investigation, containment, and vaccination costs for all evaluations except for 1, where response costs only included investigation and containment costs [13].
Table 2.
Type of Costs Collected and Perspective, by Study
| Perspective | Costs Collected | |||||
|---|---|---|---|---|---|---|
| Response Costs | ||||||
| Study [Ref] | Public Health | Provider | Investigation and Containment | Vaccination | Direct | Indirect/Productivity Losses |
| Chen et al (2011) [14] | No | Yes | Yes | Yes | No | No |
| Coleman et al (2012) [11] | Yesa | Yes | Yes | Yes | Yes | No |
| Dayan et al (2005) [15] | Yes | No | Yes | Yes | No | No |
| Helmecke et al (2014) [16] | No | Yes | Yes | Yes | Yes | No |
| Marx et al, case 1 (2017) [13] | Yes | No | Yes | Yes | No | No |
| Marx et al, case 2 (2017) [13] | Yes | No | Yes | Yes | No | No |
| McCullough et al (2019) [17] | Yes | No | Yes | Yes | No | No |
| Parker et al (2006) [18] | Yes | Yes | Yes | Yes | No | No |
| Rosen et al (2018) [19] | Yes | No | Yes | Yes | No | No |
| Sugerman et al (2010) [20] | Yesb | No | Yes | Yes | Yes | Yes |
| Wendorf et al (2015) [21] | No | Yes | Yes | Yes | No | No |
Perspective not stated, but all costs were public health response and direct medical costs. Direct medical costs included in provider perspective, not included in public health perspective calculations.
Direct medical costs and costs accrued by quarantined families also collected, but not included in public health perspective calculations.
Outbreaks in reviewed studies reported a total of 129 confirmed measles cases in 9 states during the period of 2004–2017, with a median of 2 cases (range, 1–58) and a median of 283 contacts (range, 44–8231) (Table 3). The median duration of the chain of transmission was 13 days (range, 0–88 days), with a median 68-day investigation period (range, 41–159 days) (Table 3). Personnel-hours spent responding to the outbreaks ranged from 387 to 10 054 hours (Supplementary Table 1). With data from only 3 of 11 outbreaks, we also found that outbreak responses involved the efforts of 41–99 public health personnel (Supplementary Table 1).
Table 3.
Median Total and Per Costs of 11 United States Measles Outbreaks, 2004–2017
| Study | Ref. | Location | Year of Case(s) | Cases, No. | Contacts, No. | CD, d | IP, d | Total Costs | Per Case Cost | Per Contact Cost | Per Day Cost Using CD | Per Day Cost Using IPa |
|---|---|---|---|---|---|---|---|---|---|---|---|---|
| Chen et al (2011) | [14] | Tucson, AZ | 2008 | 14 | 8231 | 79 | 159 | $1 063 936 | $75 995 | $129 | $13 468 | $6691 |
| Coleman et al (2012) | [11] | Louisville, KY | 2010 | 1 | 44 | 0 | NR | $32 805 | $32 805 | $746 | NA | … |
| Dayan et al (2005) | [15] | Iowa | 2004 | 3 | 1000 | 9 | 68 | $222 633 | $74 211 | $223 | $24 737 | $3274 |
| Helmecke et al (2014) | [16] | Albany, NY | 2011 | 2 | 265 | 15 | NR | $76 509 | $38 255 | $289 | $5101 | … |
| Marx et al (2017) | [13] | Denver, CO | 2016 | 1 | 283 | 0 | NR | $52 026 | $52 026 | $184 | NA | … |
| Marx et al (2017) | [13] | Denver, CO | 2017 | 1 | 232 | 0 | NR | $18 787 | $18 787 | $81 | NA | … |
| McCullough et al (2019)b | [17] | Phoenix, AZ | 2015 | 2 | 215 | 13 | 41 | $152 308 | $76 154 | $708 | $11 716 | $3715 |
| Parker et al (2006) | [18] | Indiana | 2005 | 34 | 500 | 39 | 67a | $251 461 | $7396 | $503 | $6448 | $3753 |
| Rosen et al (2018) | [19] | New York City, NY | 2013 | 58 | 3409 | 88 | 109 | $449 736 | $7418 | $126 | $5111 | $4126 |
| Sugerman et al (2010) | [20] | San Diego, CA | 2008 | 12 | 839 | 22 | 59 | $235 624 | $18 783 | $269 | $10 710 | $3994 |
| Wendorf et al (2015) | [21] | Seattle, WA | 2013 | 1 | 122 | 0 | NR | $9862 | $14 855 | $122 | NA | … |
| Median | … | … | … | 2 | 283 | 13 | 68 | $152 308 | $32 805 | $223 | $10 710 | $3873 |
| (Range) | … | … | … | (1–58) | (44–8231) | (0–88) | (41–159) | ($9862–$ 1 063 936) | ($7396–$76 154) | ($81–$746) | ($5101–$24 737) | ($327–$6691) |
Ranges are reported as minimum–maximum.
Abbreviations: AZ, Arizona; CD, chain duration; CO, Colorado; IP, investigation period; KY, Kentucky; NA, not applicable to only 1 case; NY, New York; NR, not reported; WA, Washington.
IP is as reported in the manuscript being evaluated.
Published online in 2018 with a print version published in 2019.
Across all evaluations, the median total cost of the 11 measles outbreaks was $152 308 (range, $9862–$1 063 936; note that the outbreak with $1 063 936 in costs included the highest number of contacts [8231 contacts]) (Table 3). Subsetting by perspective, median total costs were $115 102 from the public health perspective (Table 4), and $76 509 from the provider perspective (Table 4). The median cost per case was $32 805 (range, 7396–76 154) and per contact $223 (range, $81–$746) from all perspectives, with corresponding median costs of $18 661 and $191 from the public health perspective, and $14 270 and $289 from the provider perspective. Median cost per day was $10 710 (range, $5101–$24 737) based on chain duration, and $3873 (range, $3274–$6691) based on investigation period, with corresponding median costs of $7535 and $3274 from the public health perspective, and $5101 and $4641 from the provider perspective.
Table 4.
Median Total and Per Costs of United States Measles Outbreaks, 2004–2017, by Perspective
| Perspective and Study | Location | Outbreak Year | Cases, No. | Contacts, No. |
CD, d | IP d | Total Costs | Per Case Cost | Per Contact Cost | Per Day Cost Using CD | Per Day Cost Using IP |
|---|---|---|---|---|---|---|---|---|---|---|---|
| Public health perspective | |||||||||||
| Coleman et al (2012) [11] | Louisville, KY | 2010 | 1 | 44 | 0 | NR | $18 534 | $18 534 | $421 | NA | … |
| Dayan et al (2005) [15] | Iowa | 2004 | 3 | 1000 | 9 | 68 | $222 633 | $74 211 | $223 | $24 737 | $3274 |
| Marx et al (2017) [13] | Denver, CO | 2016 | 1 | 283 | 0 | NR | $52 026 | $52 026 | $184 | NA | … |
| Marx et al (2017) [13] | Denver, CO | 2017 | 1 | 232 | 0 | NR | $18 787 | $18 787 | $81 | NA | … |
| McCullough et ala (2019) [17] | Phoenix, AZ | 2015 | 2 | 215 | 13 | 41 | $152 308 | $76 154 | $708 | $11 716 | $3715 |
| Parker et al (2006) [18] | Indiana | 2005 | 34 | 500 | 39 | 67 | $77 897 | $2291 | $156 | $1997 | $1163 |
| Rosen et al (2018) [19] | New York City, NY | 2013 | 58 | 3409 | 88 | 109 | $449 736 | $7754 | $132 | $5111 | $4126 |
| Sugerman et al (2010) [20] | San Diego, CA | 2008 | 12 | 839 | 22 | 59 | $165 777 | $13 815 | $198 | $7535 | $2810 |
| Median | … | … | … | … | … | … | $115 102 | $18 661 | $191 | $7535 | $3274 |
| (Range) | … | … | … | … | … | … | ($18 534–$449 736) | ($2291–$76 154) | ($81–$708) | ($1997–$24 737) | ($ 1163–$4126) |
| Provider perspective | |||||||||||
| Chen et al (2011) [14] | Tucson, AZ | 2008 | 14 | 8231 | 79 | 159 | $1 063 936 | $75 995 | $129 | $13 468 | $6691 |
| Coleman et al (2012) [11] | Louisville, KY | 2010 | 1 | 44 | 0 | NR | $14 270 | $14 270 | $324 | NA | … |
| Helmecke et al (2014) [16] | Albany, NY | 2011 | 2 | 265 | 15 | NR | $76 509 | $38 255 | $289 | $5101 | … |
| Parker et al (2006) [18] | Indiana | 2005 | 34 | 500 | 39 | 67 | $173 564 | $5105 | $347 | $4450 | $2591 |
| Wendorf et al (2015) [21] | Seattle, WA | 2013 | 1 | 122 | 0 | NR | $9862 | $9862 | $81 | NA | … |
| Median | … | … | … | … | … | … | $76 509 | $14 270 | $289 | $5101 | $4641 |
| (Range) | … | … | … | … | … | … | ($9862–$1 063 936) | ($5105–$75 995) | ($81–$347) | ($4450–$ 13 468) | ($2591–$6691) |
Ranges are reported as minimum–maximum.
Abbreviations: AZ, Arizona; CA, California; CD, chain duration; CO, Colorado; IP, investigation period; KY, Kentucky; NR, not reported; NY, New York; WA, Washington.
Published online in 2018 with a print version published in 2019.
Median response cost per case was $18 787 (range, $7396–$76 154) and per contact was $184 ($81–$708) (Table 5), with corresponding median containment costs of $18 787 and $163 (Table 5), and median vaccination costs of $2781 and $41 (Table 5). The median response cost per day based on chain duration was $7535 (range, $3173–$24 737) and on investigation period was $3734 (range, $2810–$6691), with corresponding median containment costs of $7525 and $3258, and median vaccination costs of $834 and $476.
Table 5.
Median Total and Per Costs of United States Measles Outbreaks, 2004–2017, by Type of Cost
| Study | Location | Outbreak Year | Hospitalized | Total Costs | Per Case Cost | Per Contact Cost | Per Day Cost Using CD | Per Day Cost Using IPa | Per Hospitalized Costb |
|---|---|---|---|---|---|---|---|---|---|
| Response | |||||||||
| Chen et al (2011) [14] | Tucson, AZ | 2008 | … | $1 063 936 | $75 995 | $129 | $13 468 | $6691 | … |
| Coleman et al (2012) [11] | Louisville, KY | 2010 | … | $18 534 | $18 534 | $421 | … | NA | … |
| Dayan et al (2005) [15] | Iowa | 2004 | … | $222 633 | $74 211 | $223 | $24 737 | $3274 | … |
| Helmecke et al (2014) [16] | Albany, NY | 2011 | … | $47 597 | $23 799 | $180 | $3173 | NA | … |
| Marx et al (2017) [13] | Denver, CO | 2016 | … | $52 026 | $52 026 | $184 | … | NA | … |
| Marx et al (2017) [13] | Denver, CO | 2017 | … | $18 787 | $18 787 | $81 | … | NA | … |
| McCullough et alc (2019) [17] | Phoenix, AZ | 2015 | … | $152 308 | $76 154 | $708 | $11 716 | $3715 | … |
| Parker et al (2006) [18] | Indiana | 2005 | … | $251 461 | $7396 | $503 | $6448 | $3753 | … |
| Rosen et al (2018) [19] | New York City, NY | 2013 | … | $449 736 | $7754 | $132 | $5111 | $4126 | … |
| Sugerman et al (2010) [20] | San Diego, CA | 2008 | … | $165 777 | $13 815 | $198 | $7535 | $2810 | … |
| Wendorf et al (2015) [21] | Seattle, WA | 2013 | … | $9862 | $9862 | $81 | … | … | … |
| Median | … | … | … | $152 308 | $18 787 | $184 | $7535 | $3734 | … |
| (Range) | … | … | … | ($9862-$ 1 063 936) | ($7396–$76 154) | ($81–$708) | ($3173–$24 737) | ($2810–$6691) | … |
| Response: investigation and containment | |||||||||
| Chen et al (2011) [14] | Tucson, AZ | 2008 | … | $767 073 | $54 791 | $93 | $9710 | $4824 | … |
| Coleman et al (2012) [11] | Louisville, KY | 2010 | … | $16 257 | $16 257 | $369 | … | NA | … |
| Dayan et al (2005) [15] | Iowa | 2004 | … | $177 367 | $59 122 | $177 | $19 707 | $2608 | … |
| Helmecke et al (2014) [16] | Albany, NY | 2011 | … | $43 295 | $21 648 | $163 | $2886 | NA | … |
| Marx et al (2017) [13] | Denver, CO | 2016 | … | $38 646 | $38 646 | $137 | … | NA | … |
| Marx et al (2017) [13] | Denver, CO | 2017 | … | $18 787 | $18 787 | $81 | … | NA | … |
| McCullough et alc (2019) [17] | Phoenix, AZ | 2015 | … | $133 216 | $66 608 | $620 | $10 247 | $3249 | … |
| Parker et al (2006) [18] | Indiana | 2005 | … | $218 932 | $6439 | $438 | $5614 | $3268 | … |
| Rosen et al (2018) [19] | New York City, NY | 2013 | … | $429 680 | $7408 | $126 | $4883 | $3942 | … |
| Sugerman et al (2010) [20] | San Diego, CA | 2008 | … | $165 560 | $13 797 | $197 | $7525 | $2806 | … |
| Wendorf et al (2015) [21] | Seattle, WA | 2013 | … | $6578 | $6578 | $54 | … | NA | … |
| Median | … | … | … | $133 216 | $18 787 | $163 | $7525 | $3258 | … |
| (Range) | … | … | … | ($6578-$767 073) | ($6439–$66 608) | ($54–$620) | ($2886–$19 707) | ($2608–$4824) | … |
| Response: vaccination | |||||||||
| Chen et al (2011) [14] | Tucson, AZ | 2008 | … | $296 864 | $21 205 | $36 | $3758 | $1867 | … |
| Coleman et al (2012) [11] | Louisville, KY | 2010 | … | $2277 | $2277 | $52 | … | NA | … |
| Dayan et al (2005) [15] | Iowa | 2004 | … | $45 266 | $15 089 | $45 | $5030 | $666 | … |
| Helmecke et al (2014) [16] | Albany, NY | 2011 | … | $4302 | $2151 | $16 | $287 | NA | … |
| Marx et al (2017) [13] | Denver, CO | 2016 | … | $13 381 | $13 381 | $47 | … | NA | … |
| McCullough et alc (2019) [17] | Phoenix, AZ | 2015 | … | $19 092 | $9546 | $89 | $1469 | $466 | … |
| Parker et al (2006) [18] | Indiana | 2005 | … | $32 529 | $957 | $65 | $834 | $486 | … |
| Rosen et al (2018) [19] | New York City, NY | 2013 | … | $20 055 | $346 | $6 | $228 | $184 | … |
| Sugerman et al (2010) [20] | San Diego, CA | 2008 | … | $217 | $18 | $0 | $10 | $4 | … |
| Wendorf et al (2015) [21] | Seattle, WA | 2013 | … | $3284 | $3284 | $27 | … | NA | … |
| Median | … | … | … | $16 236 | $2781 | $41 | $834 | $476 | … |
| (Range) | … | … | … | ($217–$296 864) | ($18–$21 205) | (0–$89) | ($10–$5030) | ($4–$ 1867) | … |
| Direct medical | |||||||||
| Coleman et al (2012) [11] | Louisville, KY | 2010 | 1 | $14 270 | $14 270 | $324 | … | NA | $12 171 |
| Helmecke et al (2014) [16] | Albany, NY | 2011 | 2 | $28 912 | $14 456 | $109 | $1927 | NA | $14 456 |
| Sugerman et al (2010) [20] | San Diego, CA | 2008 | 1 | $21 519 | $1793 | $26 | $978 | $365 | $19 249 |
| Median | … | … | … | $21 519 | $14 270 | $109 | $1453 | $365 | $14 456 |
| (Range) | … | … | … | ($14 270-$28 912) | ($1793-$14 456) | ($26-$324) | ($978-$1927) | ($365-$365) | ($12 171-$19 249) |
Ranges are reported as minimum–maximum.
Abbreviations: AZ, Arizona; CA, California; CD, chain duration (days); CO, Colorado; IP, investigation period (days); KY, Kentucky; NA, not applicable to only 1 case; NY, New York; WA, Washington.
Investigation period is as reported in the manuscript being evaluated.
Only hospitalization costs; outpatient costs were excluded from direct medical costs to calculate per hospitalization cost.
Published online in 2018 with a print version published in 2019.
Median direct medical costs of 3 outbreaks was $21 519 (range, $14 270–$28 912). The median direct medical cost per case was $14 270. The median cost per hospitalization (outpatient costs excluded) was $14 456 (Table 5).
Sugerman et al (2010) was the only study that reported indirect costs. Quarantined families reported an average $1032 (in 2018 dollars) direct and indirect costs incurred per quarantined child [20]; separate direct and indirect costs were not provided.
To understand how costs could possibly be affected by the size of the outbreak, which can be measured in terms of cases identified and duration, we examined the relationship between per case cost and outbreak size, and per day cost and chain duration, by perspective (public health and provider) and cost type (investigation and containment, vaccination, direct medical) (Figure 1). Overall costs per case and day were lower the more cases were identified and the longer the chain duration.
Figure 1.
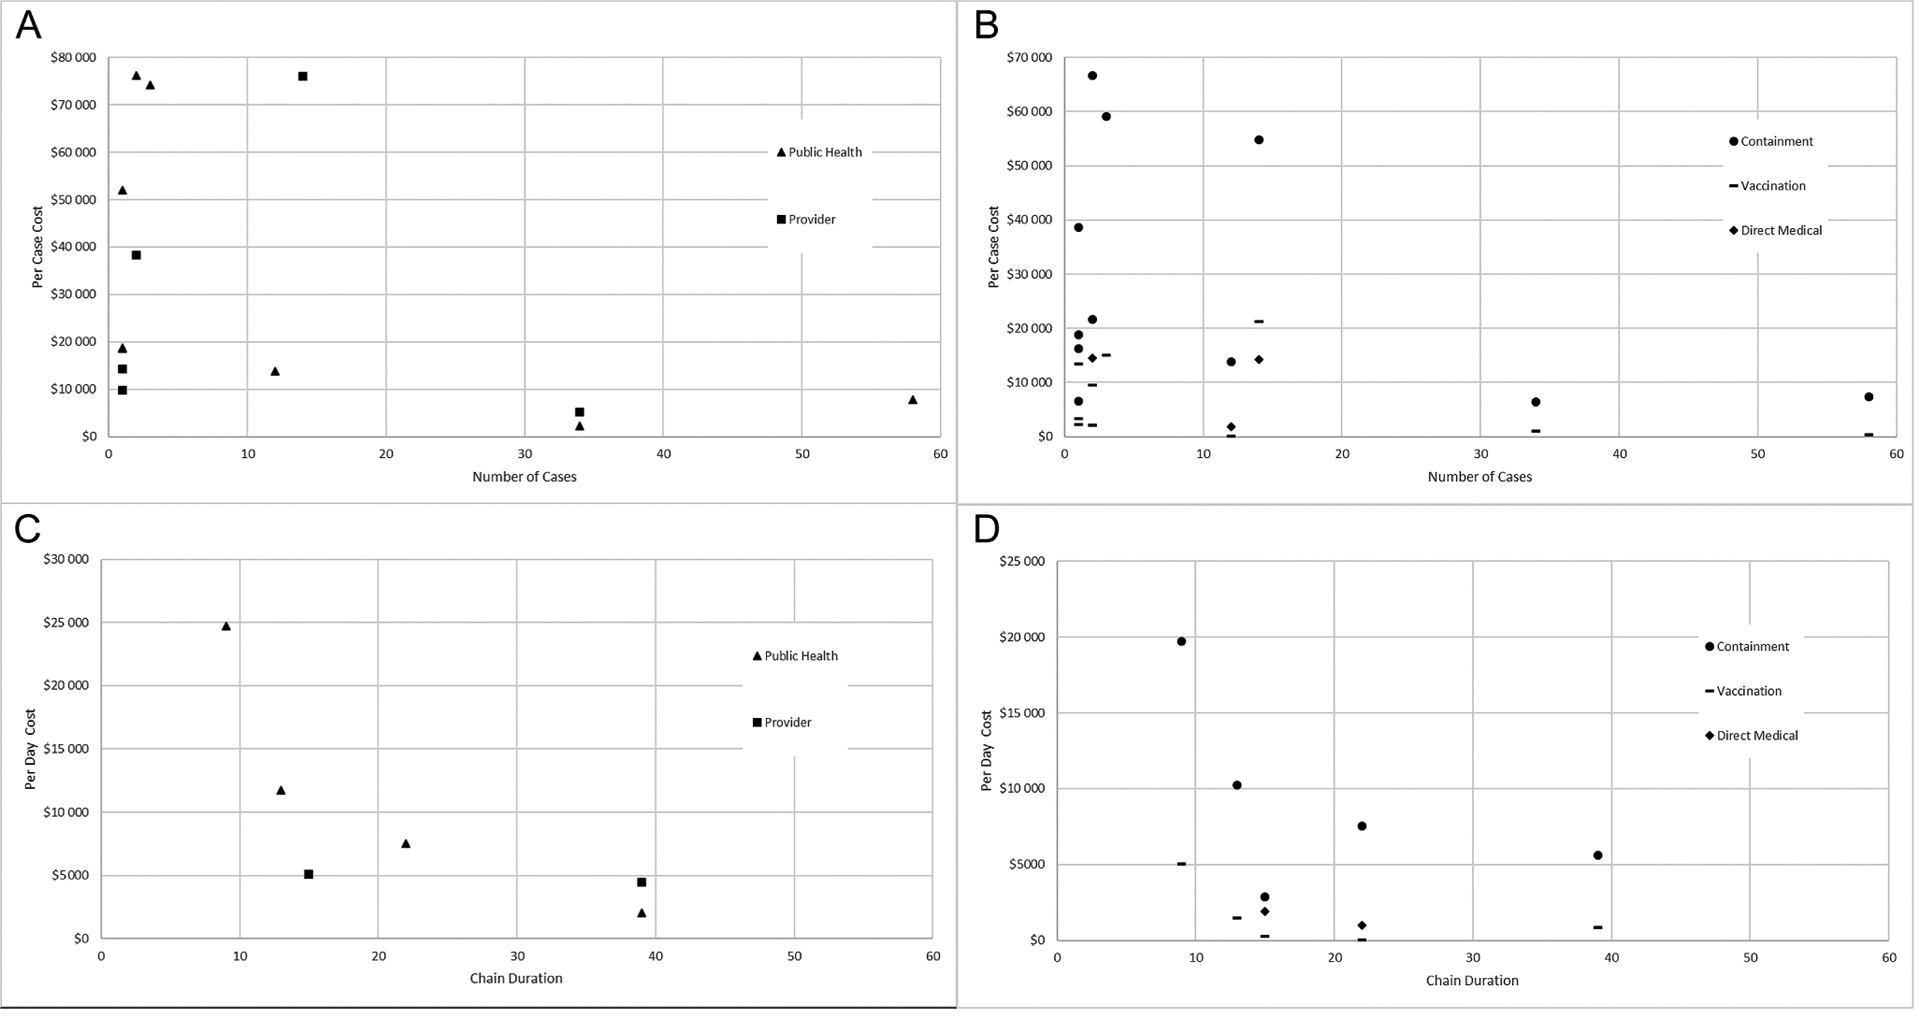
Scatterplot of per case cost and outbreak size by perspective (A), per case cost and outbreak size by type of cost (B), per day cost and chain duration by perspective (C), and per day cost and chain duration by type of cost (D).
DISCUSSION AND CONCLUSIONS
Our review of 10 studies presenting cost estimates for 11 measles outbreaks during the postelimination era (January 2004 through December 2017) found that measles can be extremely costly to public health and healthcare institutions in the US, with a median of approximately $152 000 per outbreak, approximately $33 000 per case, approximately $200 per contact, and approximately $4000 per day of investigation. Because none of these estimates captured costs from a societal perspective, these estimates are likely an underestimate of all costs incurred during measles outbreaks.
Our total median costs per response of $152 308 in 2018 dollars ($122 685 in 2011 dollars) aligned well with previous estimates by Ortega-Sanchez et al, who found that total median costs to respond to measles outbreaks, depending on the size of the outbreak, ranged from $72 000 to $179 000 in 2011 dollars [9]. In the sample of measles cases captured by this review, 4 required hospitalization, which carried a median direct medical cost per hospitalization of $14 456 in 2018 dollars ($11 202 in 2009 dollars). Due to the small sample size of hospitalized cases, caution is warranted when generalizing our estimate of cost per hospitalization to any broader populations. Nevertheless, this estimate appears to be generally consistent with Zhou et al’s estimate of $3562–$40 695 in 2009 dollars [22] (the Zhou et al estimate may take into account a larger disease spectrum in terms of complications that are usually not seen in outbreaks), although much higher than a recently published median estimate of $5291 per hospitalization in 2017 dollars ($5395 in 2018 dollars) [23].
Other countries have similarly documented the substantial economic burden associated with measles outbreaks. In the United Kingdom, total public health costs associated with an outbreak in Merseyside were $1 554 027 ($4995 per case), and direct hospital costs per admitted case were $3580 (in 2018 dollars) [24]. In the Netherlands, during a 2013–2014 outbreak affecting Orthodox Protestant communities with low MMR vaccination coverage [25], public health costs for outbreak containment were an estimated $796 194 ($295 per case), and direct healthcare costs were $530 per case (in 2018 dollars). The variability in these cost estimates could be attributed to a variety of factors, including the components incorporated in the cost estimates, the setting in which the outbreaks occurred, the intensity of containment efforts, and the extent to which healthcare is paid for by a government.
Our study found that vaccination costs comprised a small portion of all response costs, when compared to investigation and containment; this is not unexpected, given that measles vaccine doses are fairly inexpensive. The costs of supplies and personnel-time needed for vaccination clinics constitute only a portion of response efforts, whereas the bulk of the response involves case and contact investigations, laboratory testing, verifying measles immunity, communicating with the public, and operational needs and coordination. Similarly, we found response costs to be higher than direct medical costs. Finally, costs per case and day generally declined with increasing size and duration of measles outbreaks. This may be due to fixed costs incurred in any investigation regardless of the number of cases or chain duration.
Although the information provided in these studies is useful, there are significant gaps in the literature regarding the cost of measles outbreaks from the societal perspective. Specifically, more studies that include not only response costs, but direct and indirect costs of outbreaks, would be of added value. Studies evaluating the societal costs of measles outbreaks would improve our understanding of the full economic ramifications of responding to measles cases, and could better inform cost-effectiveness or cost-benefit analyses examining the impact of various prevention and control strategies. Future studies should also provide detailed information on the number of contacts evaluated, investigation periods, and personnel-hours to further characterize the relationship of containment costs and the breadth of the response. The implication of such studies would be particularly important because of recent increases in measles activity in the US [5], and because many local health departments are experiencing reductions in resources and do not have “outbreak” budget reserves [26].
This study has several limitations. First, because our review is limited to available published data and did not include gray literature, our estimates are based on limited measles responses, which showed considerable variability, and our summary of costs might not be representative of all outbreak responses in the US; in particular, there could be a bias toward publication of more costly outbreaks. Second, details of the types of costs presented were not always fully available, although we attempted to classify costs into predetermined categories when possible. For example, documenting costs related to investigation of cases and those related to containment separately would be helpful in more clearly delineating the economic impact of each of these activities. Last, certain attributes and response activities are unique to each outbreak (eg, the strength of quarantine recommendations, or the amount of laboratory testing and contact tracing performed), which makes it challenging for appropriate comparisons to be made across studies.
Although US measles elimination has been maintained for nearly 20 years, measles introductions and cases continue to occur in the country, and they impose a substantial economic burden. Applying our median per case cost estimate of approximately $33 000 to the annual median of 72 cases reported in the US from 2001 through 2017 [8] translates to more than $2 million in costs per year. Furthermore, based on the number of cases reported in 2019 (1282 cases) [27], an estimated $42 million might have been spent responding to measles outbreaks in 2019. In this period of increased disease, understanding the full economic ramifications of responding to measles outbreaks is necessary to appropriately allocate valuable public health resources for maximum public benefit and to inform cost-of-illness and cost-effectiveness studies of measles and measles prevention.
Supplementary Material
Footnotes
Supplementary Data
Supplementary materials are available at Clinical Infectious Diseases online. Consisting of data provided by the authors to benefit the reader, the posted materials are not copyedited and are the sole responsibility of the authors, so questions or comments should be addressed to the corresponding author.
Publisher's Disclaimer: Disclaimer. The findings and conclusions in this report are those of the authors and do not necessarily represent the views of the Centers for Disease Control and Prevention.
Potential conflicts of interest. The authors: No reported conflicts of interest. All authors have submitted the ICMJE Form for Disclosure of Potential Conflicts of Interest.
References
- 1.Fiebelkorn AP, Redd SB, Gastanaduy PA, et al. A comparison of postelimination measles epidemiology in the United States, 2009–2014 versus 2001–2008. J Pediatric Infect Dis Soc 2017; 6:40–8. [DOI] [PMC free article] [PubMed] [Google Scholar]
- 2.Perry RT, Halsey NA. The clinical significance of measles: a review. J Infect Dis 2004; 189(Suppl 1):S4–16. [DOI] [PubMed] [Google Scholar]
- 3.Orenstein WA, Samuel KL, Hinman AR. Summary and conclusions: measles elimination meeting, 16–17 March 2000. J Infect Dis 2004; 189(Suppl 1):S43–7. [DOI] [PubMed] [Google Scholar]
- 4.Papania MJ, Wallace GS, Rota PA, et al. Elimination of endemic measles, rubella, and congenital rubella syndrome from the Western hemisphere: the US experience. JAMA Pediatr 2014; 168:148–55. [DOI] [PubMed] [Google Scholar]
- 5.Patel M, Lee AD, Redd SB, et al. Increase in measles cases—United States, January 1–April 26, 2019. MMWR Morb Mortal Wkly Rep 2019; 68:402–4. [DOI] [PubMed] [Google Scholar]
- 6.Gastañaduy PA, Paul P, Fiebelkorn AP, et al. Assessment of the status of measles elimination in the United States, 2001–2014. Am J Epidemiol 2017; 185:562–9. [DOI] [PMC free article] [PubMed] [Google Scholar]
- 7.Lee A, Clemmons NS, Redd SB, Patel M, Gastanaduy P. International importations of measles virus into the United States during the post-elimination era, 2001–2015. Open Forum Infect Dis 2017; 4(Suppl 1):S242. [DOI] [PMC free article] [PubMed] [Google Scholar]
- 8.Clemmons NS, Wallace GS, Patel M, Gastanaduy PA. Incidence of measles in the United States, 2001–2015. JAMA 2017; 318:1279–81. [DOI] [PMC free article] [PubMed] [Google Scholar]
- 9.Ortega-Sanchez IR, Vijayaraghavan M, Barskey AE, Gregory SW. The economic burden of sixteen measles outbreaks on United States public health departments in 2011. Vaccine 2014; 32:1311–7. [DOI] [PubMed] [Google Scholar]
- 10.Lo NC, Hotez PJ. Public health and economic consequences of vaccine hesitancy for measles in the United States. JAMA Pediatr 2017; 171:887–92. [DOI] [PMC free article] [PubMed] [Google Scholar]
- 11.Coleman MS, Garbat-Welch L, Burke H, et al. Direct costs of a single case of refugee-imported measles in Kentucky. Vaccine 2012; 30:317–21. [DOI] [PubMed] [Google Scholar]
- 12.US Department of Labor, Bureau of Labor Statistics. Consumer Price Index, seasonally adjusted, medical care. Available at: https://www.bls.gov/data/. Accessed 29 August 2018. [Google Scholar]
- 13.Marx GE, Chase J, Jasperse J, et al. Public health economic burden associated with two single measles case investigations—Colorado, 2016–2017. MMWR Morb Mortal Wkly Rep 2017; 66:1272. [DOI] [PMC free article] [PubMed] [Google Scholar]
- 14.Chen SY, Anderson S, Kutty PK, et al. Health care–associated measles outbreak in the United States after an importation: challenges and economic impact. J Infect Dis 2011; 203:1517–25. [DOI] [PubMed] [Google Scholar]
- 15.Dayan GH, Ortega-Sánchez IR, LeBaron CW, Quinlisk MP; Iowa Measles Response Team. The cost of containing one case of measles: the economic impact on the public health infrastructure—Iowa, 2004. Pediatrics 2005; 116:e1–4. [DOI] [PubMed] [Google Scholar]
- 16.Helmecke MR, Elmendorf SL, Kent DL, Pauze DK, Pauze DR. Measles investigation: a moving target. Am J Infect Control 2014; 42:911–5. [DOI] [PubMed] [Google Scholar]
- 17.McCullough JM, Fowle N, Sylvester T, et al. Cost analysis of 3 concurrent public health response events: financial impact of measles outbreak, Super Bowl surveillance, and Ebola surveillance in Maricopa County. J Public Health Manag 2019; 25:357–65. [DOI] [PubMed] [Google Scholar]
- 18.Parker AA, Staggs W, Dayan GH, et al. Implications of a 2005 measles outbreak in Indiana for sustained elimination of measles in the United States. N Engl J Med 2006; 355:447–55. [DOI] [PubMed] [Google Scholar]
- 19.Rosen JB, Arciuolo RJ, Khawja AM, Fu J, Giancotti FR, Zucker JR. Public health consequences of a 2013 measles outbreak in New York City. JAMA Pediatr 2018; 172:811–7. [DOI] [PMC free article] [PubMed] [Google Scholar]
- 20.Sugerman DE, Barskey AE, Delea MG, et al. Measles outbreak in a highly vaccinated population, San Diego, 2008: role of the intentionally undervaccinated. Pediatrics 2010; 125:747–55. [DOI] [PubMed] [Google Scholar]
- 21.Wendorf KA, Kay M, Ortega-Sanchez IR, Munn M, Duchin J. Cost of measles containment in an ambulatory pediatric clinic. Pediatr Infect Dis J 2015; 34:589–93. [DOI] [PubMed] [Google Scholar]
- 22.Zhou F, Shefer A, Wenger J, et al. Economic evaluation of the routine childhood immunization program in the United States, 2009. Pediatrics 2014; 133:577–85. [DOI] [PubMed] [Google Scholar]
- 23.Hester G, Nickel A, LeBlanc J, et al. Measles hospitalizations at a United States children’s hospital 2011–2017. Pediatr Infect Dis J 2019; 38:547–52. [DOI] [PubMed] [Google Scholar]
- 24.Ghebrehewet S, Thorrington D, Farmer S, et al. The economic cost of measles: healthcare, public health and societal costs of the 2012–13 outbreak in Merseyside, UK. Vaccine 2016; 34:1823–31. [DOI] [PubMed] [Google Scholar]
- 25.Suijkerbuijk AWM, Woudenberg T, Hahné SJM, et al. Economic costs of measles outbreak in the Netherlands, 2013–2014. Emerg Infect Dis 2015; 21:2067. [DOI] [PMC free article] [PubMed] [Google Scholar]
- 26.Duchin JS. US public health preparedness for Zika and other threats remains vulnerable. Disaster Med Public Health Prep 2016; 10:298–99. [DOI] [PubMed] [Google Scholar]
- 27.Centers for Disease Control and Prevention. Measles cases and outbreaks. 2019. Available at: https://www.cdc.gov/measles/cases-outbreaks.html. Accessed 7 January 2020.
Associated Data
This section collects any data citations, data availability statements, or supplementary materials included in this article.